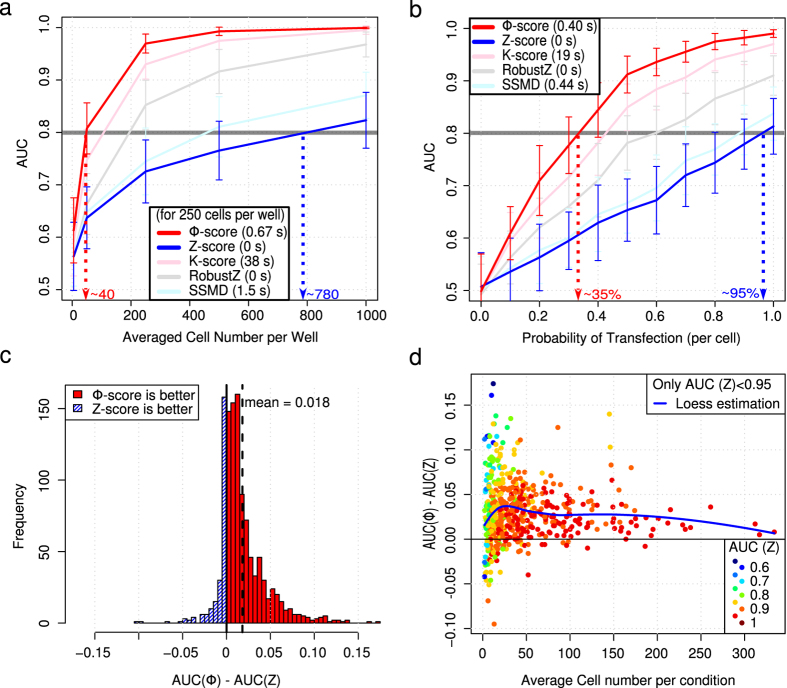
Figure 1. Comparison of scores using simulations and a validation experiment with controls only.
Simulated data (a,b). (a) Benchmarking scores; Area Under Receiver Operating Characteristic Curve (AUC) as a function of average cell number. Simulations performed with lognormal distribution for cellular phenotypic values and negative binomial distribution for the number of cells per “well”. 384 wells have been simulated, and each perturbation is used in triplicate. Twenty-five perturbations out of 120 were active; each cell of an active perturbation has a probability of 60% of reducing the initial fluorescence by 30%. Each point has been simulated 50 times; error bars correspond to the standard deviation of the 50 computed AUCs. Average computation time is added for each score (for the 250 cells per well condition). The Φ-score significantly outperforms the Z-score (Wilcoxon test P-value = 6.7 × 10⁻⁸ in the 250 cells per well condition). (b) Benchmarking scores; AUC as a function of probability of transfection. Same parameters as in (a) but with an average of 150 cells per well. Validation experiment (c,d). Results (GFP per cell and perturbation) were resampled 1000 times with variable numbers of replicates and cells per well. For each resampling, an AUC was calculated for each score. (c) Histogram of AUC difference between Φ-score and Z-score. (d) AUC difference as a function of average cell number. The color code corresponds to the Z-score AUC (a high Z-score AUC is less likely to be improved). Only resampling leading to an AUC (Z-score) < 0.95 is kept. For low cell numbers, the Φ-score performs better than the Z-score. For high cell numbers, the two scores perform almost equally (AUC > 0.9).

