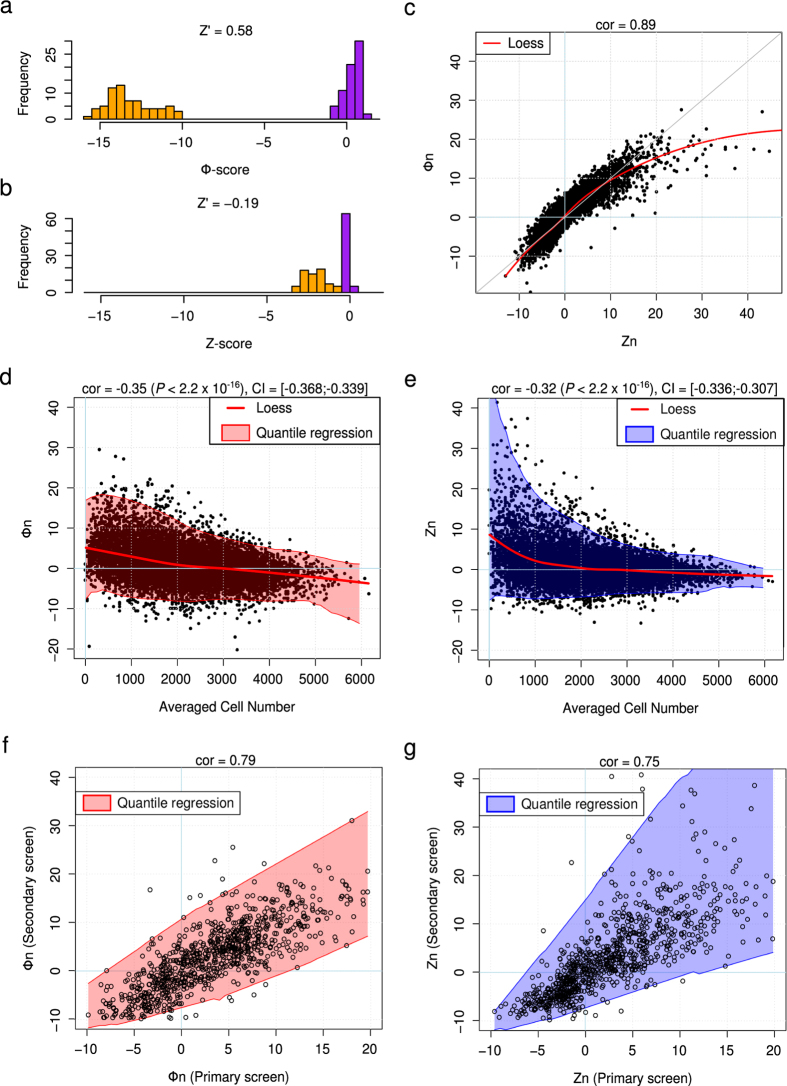
Figure 2. Φ-score and Z-score comparison with OGG1 screen.
(a) Φ-score histogram of positive (orange) and negative (purple) controls among the 138 plates. Z’ of the distributions was 0.58. (b) Same as (a) for the Z-score. Z’ = −0.19. (c) Primary screen, Φ-score as a function of the Z-score for each siRNA (normalized version of scores). In red, Loess estimation of the scores. (d) Primary screen, normalized Φ-score (Φn) as a function of the average cell number per siRNA. In red, Loess estimation; the shaded envelope corresponds to quantile regression at 1% and 99% with a moving window of 8. cor = Pearson correlation coefficient. CI = 95% Confidence Interval. (e) Same as (d) for the normalized Z-score (Zn). (f) Normalized Φ-score (Φn) per siRNA in the secondary screen as a function of the primary screen. The shaded envelope corresponds to quantile regression at 1% and 99% with a moving window of 8. (g) Same as (f) for the normalized Z-score (Zn).

