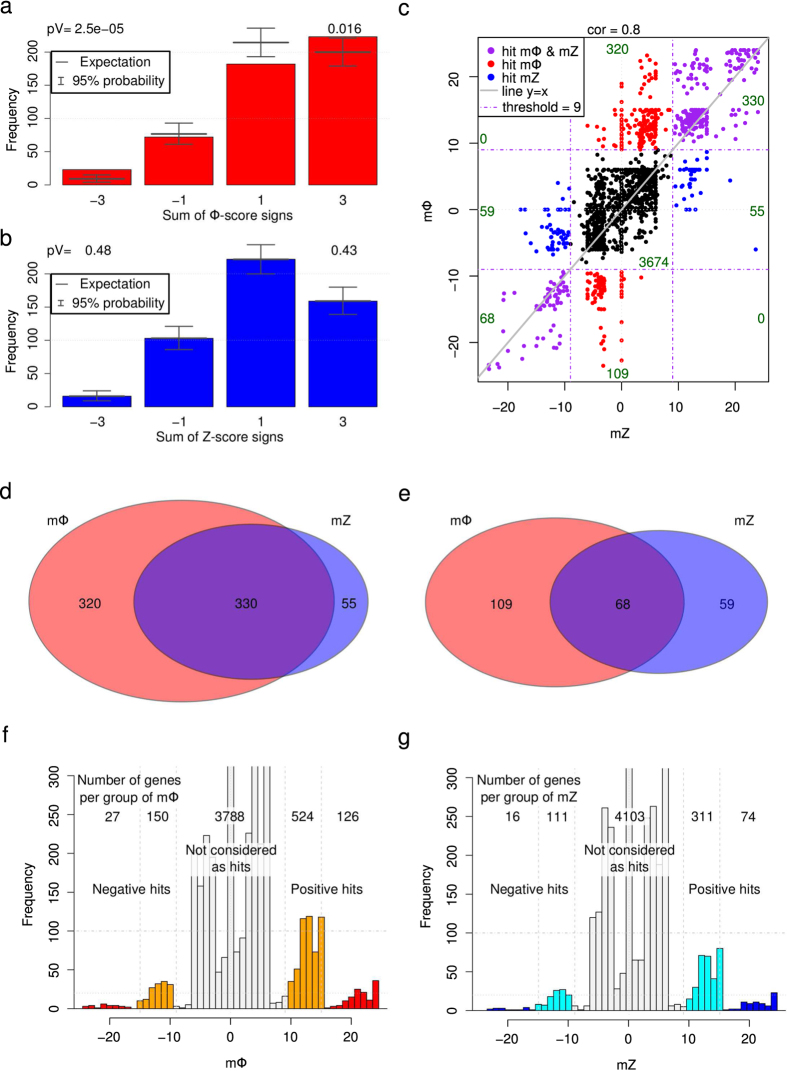
Figure 3. Merged Φ-score and Z-score comparison with the OGG1 screen.
(a) Histogram of the sum of siRNA Φ-score signs for the 500 first absolute Φ-score hits: −3 (resp. −1) indicates that all three siRNA (resp. two out of three) for a given gene have negative Φ-scores. A total of 74% of all of the 3 × 500 siRNAs are positive (p = 0.74). Above, P-values corresponding to all 3 siRNAs with the same sign. (b) Same as (a) for the Z-score, p = 0.68. (c) Merged Φ-score mΦ as a function of the merged Z-score mZ. Hits are highlighted in red (only mΦ hits), in blue (only mZ hits) and in purple (both hits). cor stands for Pearson correlation coefficient. (d) Venn diagram for positive hits. (e) Venn diagram for negative hits. (e) Histogram of mΦ. Orange and red colors highlight groups of 2 and 3 siRNA hits per gene with the same sign score, respectively. (f) Histogram of mΦ. Cyan and blue colors highlight groups of 2 and 3 siRNA hits per gene with the same sign score, respectively.

