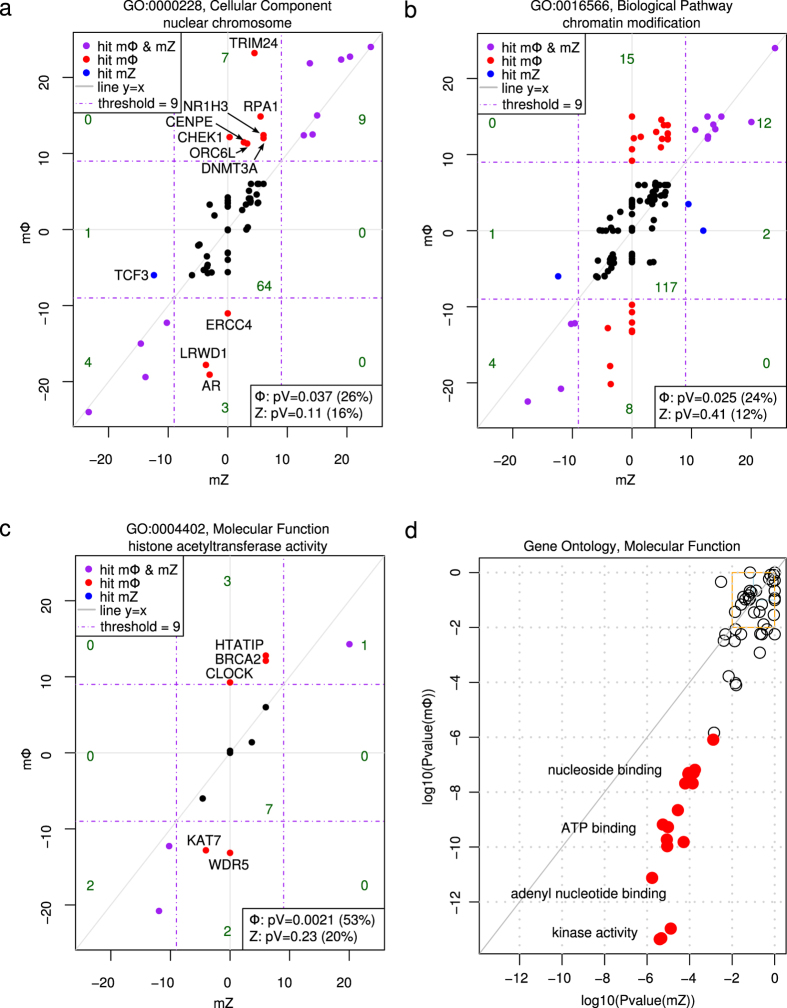
Figure 4. Gene ontology enrichment.
(a) Φ-score with respect to the Z-score for the 88 genes localized in or part of the nuclear chromosome (Cellular Component). Hits specific to one of the scores are named. Red and blue indicate specific hits for the Φ-score and Z-score, respectively. The percentage of hits among the 88 genes and associated P-values are given for each score in the lower-right box. The number of genes in each subgraph is added in green. (b) Same as (a) for the 159 genes investigated in the screen and involved in chromatin modification (Biological Pathway). (c) Same as (a) for the 15 genes involved in histone acetyltransferase activity (Molecular function). (d) For each Molecular Function ontology, the P-value of mΦ positive hits as a function of mZ positive hits (logarithm scale). Here, only strong and/or highly confident positive hits are considered (merged score above +12). The lower right half corresponds to ontologies that are more significant for Φ-score hits; red dots correspond to a difference of at least three orders of magnitude. Enriched ontologies are similar; a few have been named on the graph. In the top right boxes (non-significant ontologies), only a random selection of ontologies are plotted to lighten the graph.

