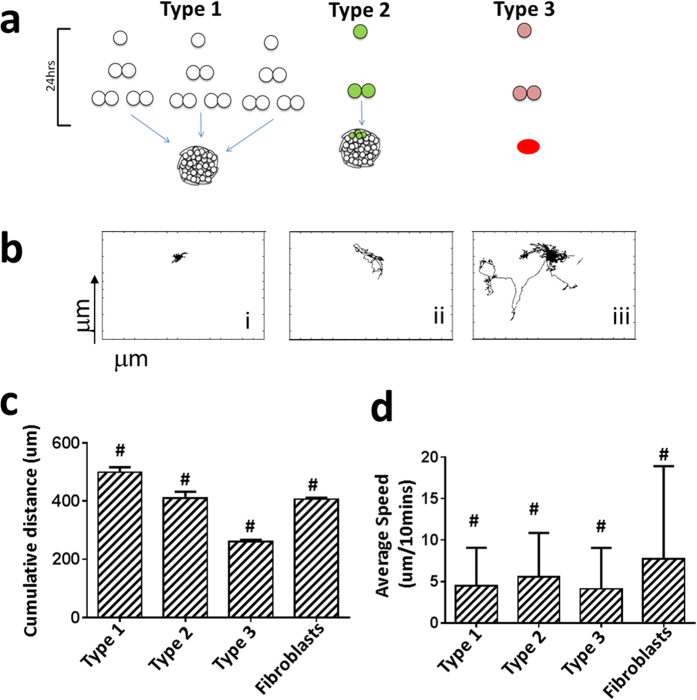
Figure 2. Characterization of cells based on dynamic properties.
(a) Classification of singe cells derived from hESC colonies based on their dynamic properties. Cells that form colonies (Type 1), cells that support colony formation (Type 2), and cells which were unable to form colonies (Type 3) (n = 48 fields of view, with 3 different sets of data). (b) Representative migratory behavior of Type 1, 2, and 3 cells when cultured at 1,500 cells/cm2. (c) Cumulative distance travelled by Type 1, 2, and 3 cells (n ~ 100–150) compared with human BJ fibroblasts (n = 100). (d) Average speed of cells (n ~ 100–150 cells each) tracked through survival and/or merge into a colony (24–48 hrs). #indicates Two Way Anova; p < 0.0001.

