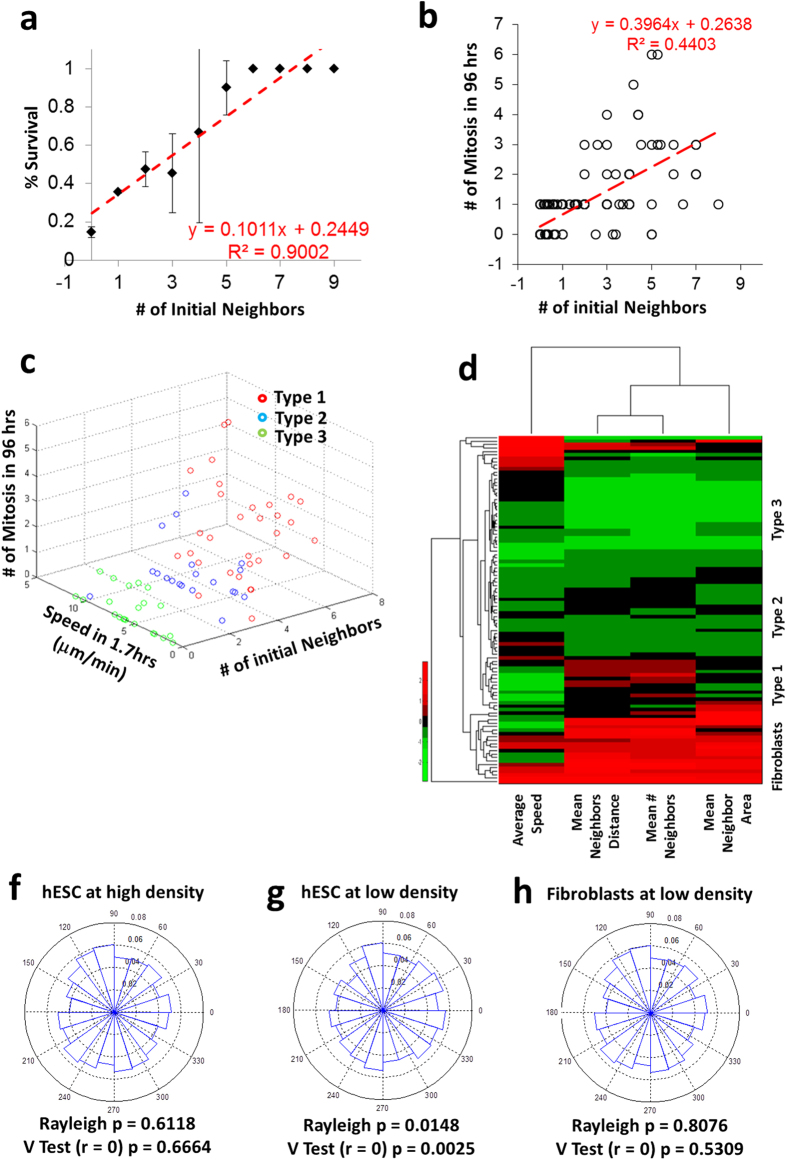
Figure 3. Influence of neighbors on isolated hESCs.
(a) Correlation of survival of cells and (b) number of mitotic events with initial number of neighbors (n ~ 20 to 40 cells). (c) 3D plot depicting the segregation of the three types of cells based on initial number of neighbors, speed and number of mitotic events (n ~ 20 to 40 cells). (d) Heat map denoting clustering of cells based on neighbor properties for hESCs (n ~ 100) and human BJ fibroblasts (n = 20). Radial histogram characterizing cell migration based on proximity to neighbors (probability of the frequency of vectors in each bin) and verified with Rayleigh test and V test for hESCs seeded at (f) 15,000 cells/cm2 and (g) 1,500 cells/cm2, and for (h) human BJ fibroblasts seeded at 1,500 cells/cm2 (n ~ 100).

