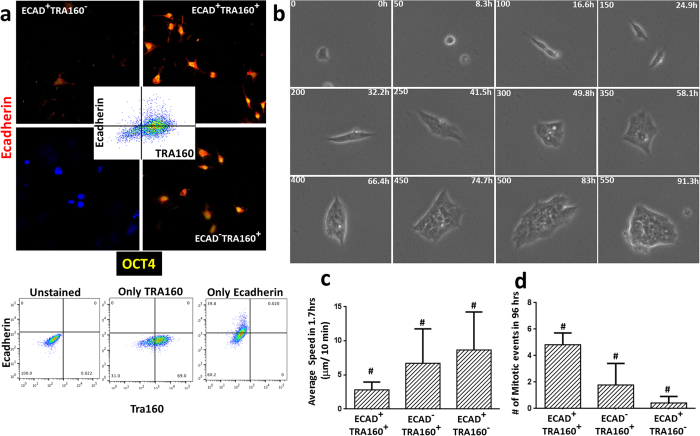
Figure 4. E-cadherin expression drives the dynamic behavior of hESCs.
(a) Representative FACS profile of hESCs based on E-cadherin and TRA160 (inset) expression revealed that not all TRA160 positive cells express membrane bound E-cadherin. FACs profile for controls used for gating. (b) Snapshot of E-cadherin and TRA160 positive cells showing clonal propagation. The three phenotypes showed similar dynamic behavior with respect to average speed (c) and number of mitotic events (d) to the cells classified based on imaging properties as shown in Fig. 1. #indicates Two Way Anova; P < 0.05 and 0.0001, respectively.

