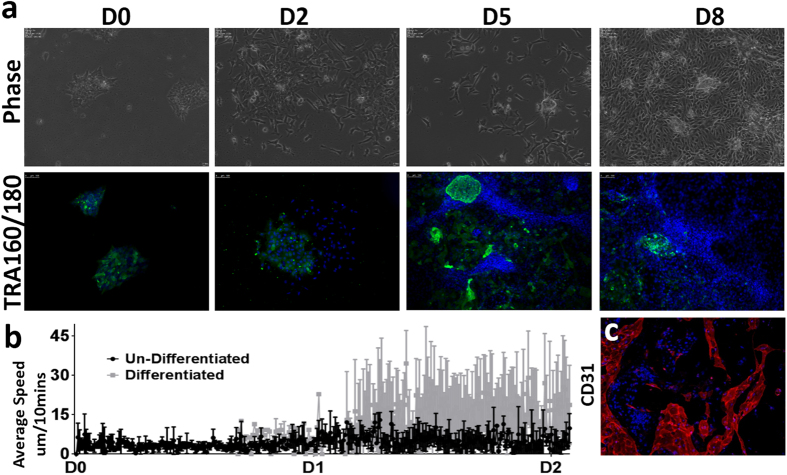
Figure 6. Dynamic behaviors during early differentiation of hESCs to vascular progenitors.
(a) Time-lapse images of H9 hESCs undergoing differentiation to vascular progenitors (CD31+/34+ cells). Representative images of cells stained with TRA160/180 during differentiation. (b) Dynamic differences (in form of average speed) between differentiated cells and undifferentiated cells during early differentiation (n = 50–100 cells per group for 3 different fields of view). (c) CD31 expressing cells on Day 8 of differentiation.

