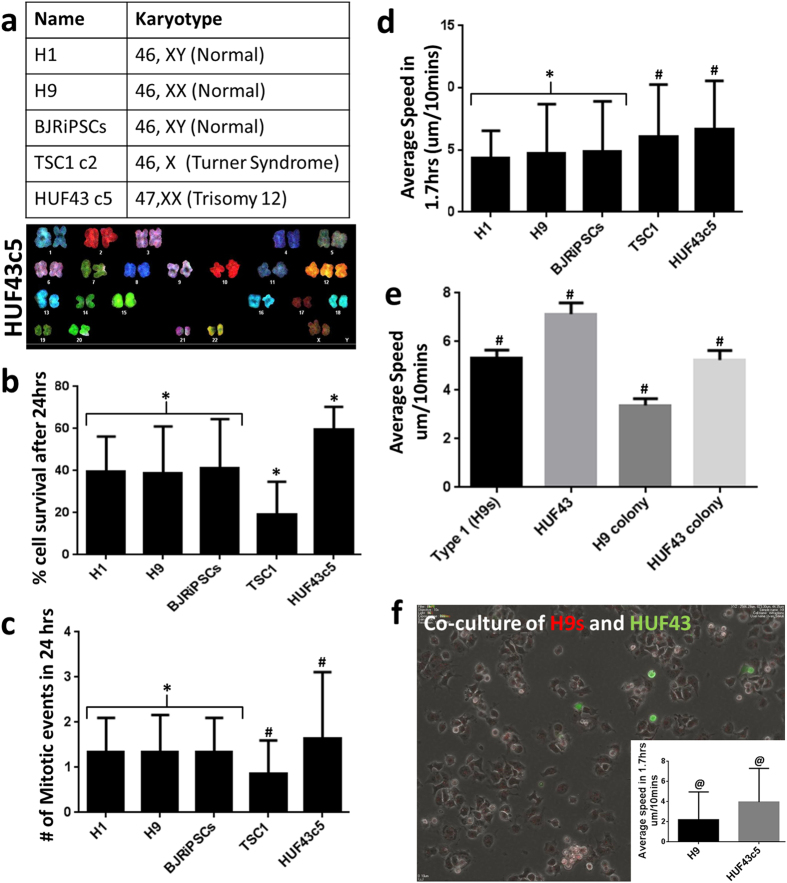
Figure 7. Dynamic behaviors of normal and abnormal karyotypic cells.
(a) Cell lines and karyotypes analyzed. (b) Percentage of cells that survived after 24 hrs of seeding. (c) Number of mitotic events in 24 hrs following cell attachment. (d) Dynamic differences across all the karyotype in form of average speed within 100 mins of cell attachment when cells were seeded at density of 1,500 cells/cm2. (e) Average speed of single cells as well as colonies derived from H9 hESCs and HUF43c5 iPSCs over 3 days. (f) Co-culture of H9 hESCs and HUF43c5 iPSCs in the ratio of 5:1. HUF43c5 cells were labeled with CFSE and their dynamic differences (inset) in terms of speed. *Indicates no statistical difference, #indicates Two Way Anova (P < 0.05) and @ indicates Student’s t test (p < 0.0001).

