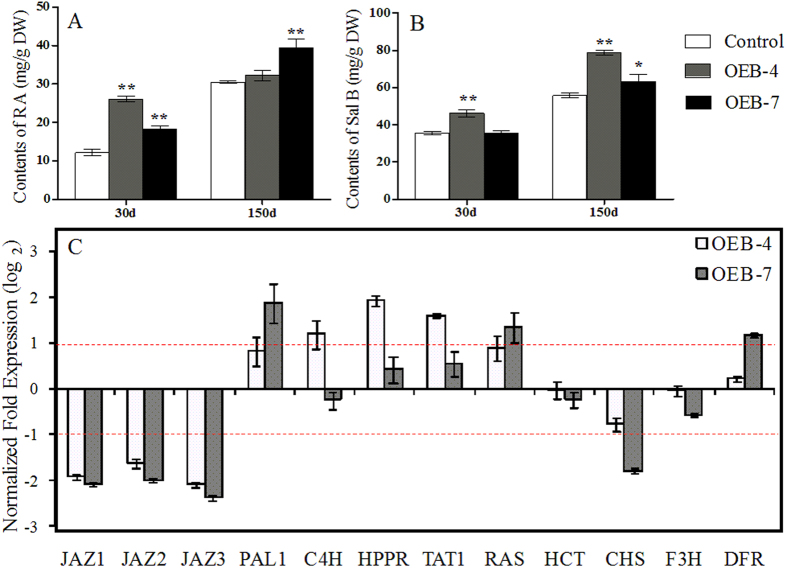
Figure 5. Specific changes in concentrations of RA (A) and Sal B (B) in roots from OEB and control lines, based on HPLC results.
(C) verification of relative gene expression via qRT-PCR. Fold-changes reflect expression in OEB-4 and OEB-7 compared with control expression, for which values were set to 1 (not shown).

