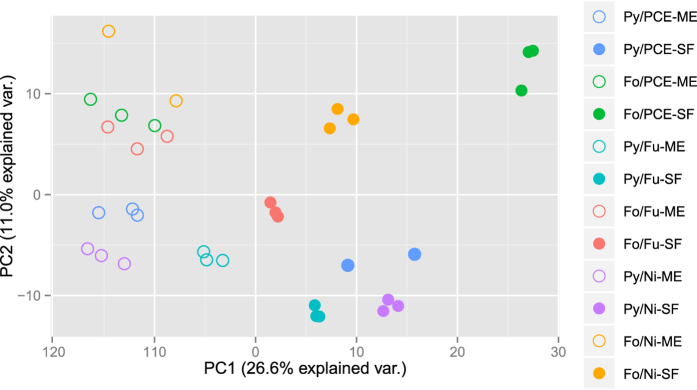
Figure 2. Principal component analysis of proteome profiles.

Cultivation conditions are indicated by different colors, membrane samples are marked with open circles, soluble fractions by filled circles. The first two letters represent the electron donor: Fo, formate; Py, pyruvate, followed by the electron acceptor Fu, fumarate; Ni, Nitrate and fraction ME, membrane extract; SF, soluble fraction. Proteins quantfied in at least half of all measurements were included in the analysis (n = 672). The conditions Fo/Ni-ME and Py/PCE-SF include two points only, as one of the biological triplicates of each were identified as outliers using statistical analysis described in the methods section and were therefore not considered in the data analysis.
