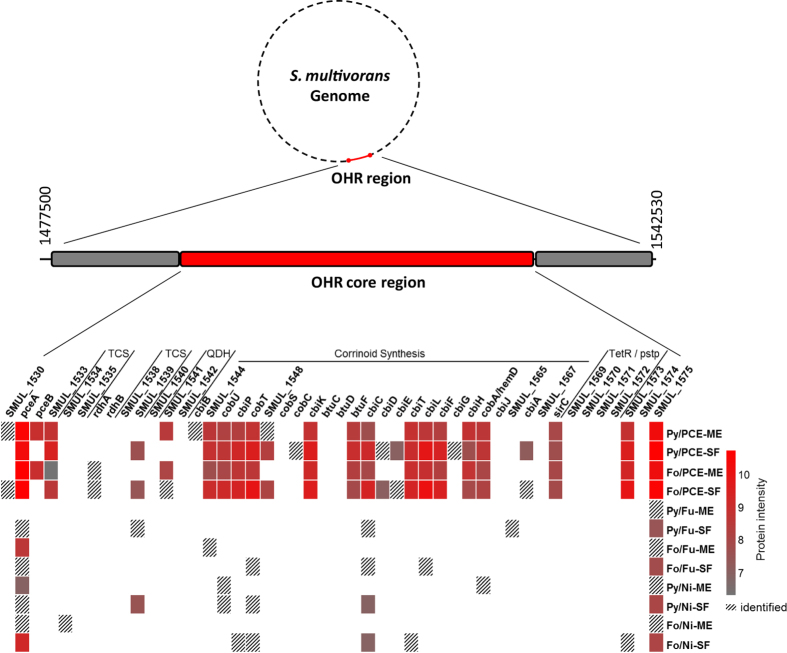
Figure 3. Identified gene products of the OHR core region as detected by proteomic analyses.
Gene names or locus tags are given at the top of the protein intensity pattern. Each square correlates to a given gene product identified or quantified under a given cultivation condition (at the right). For quantified proteins the protein intensity is provided (color code at the far right, normalized and logarithmized average of top 3 peptide area as described in the methods section), proteins identified but not quantified are marked with shaded squares. Genes which functionally belong together are grouped by flanking lines and given the following abbreviations: TCS, two component regulator system; QDH, quinol dehydrogenase; TetR/pstp, tetR pseudogene disrupted by transposase.

