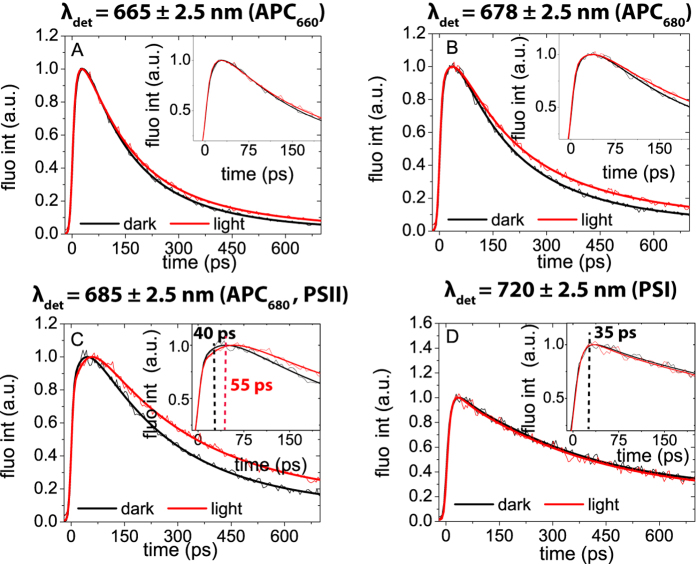
Figure 3. Comparison of original fluorescence kinetic traces (thin lines) and corresponding fitting curves (thick lines) in dark (black line) with those in light (grey line) states, taken at four emission bands: 665 nm (PBS), 678 nm (APC680), 685 nm (APC680, PSII) and 720 nm (PSI).
All measurements were done at 77 K upon 580 nm excitation. The insets zoom in on the first part of the fluorescence kinetics. Each experiment was repeated at least 3 times for different generations of the cell culture. All differences for the two states, measured for different generations, were found to be very reproducible (Fig S2).

