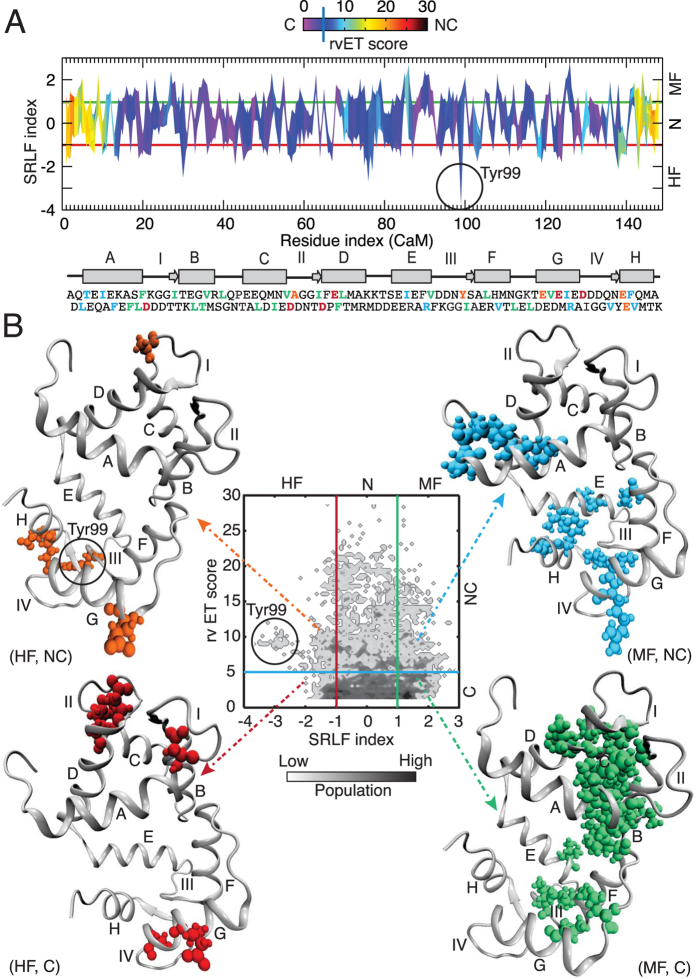
Figure 1. Distributions of evolutionary trace and local frustration of the CaM residues in the target-bound complexes.
(A) Two-dimensional map plot of real-value evolutionary trace (rvET) score vs. single residue level frustration (SRLF) index along the CaM residues. (B) Two-dimensional histogram plot of rvET score vs. SRLF index of the CaM residues. Based on the evolutionary analysis, CaM residues are divided as conserved (C, rvET score < 5) and non-conserved (NC, rvET score > 5). Based on the local frustration analysis, CaM residues are divided as highly frustrated (HF, SRLF index <−1), minimally frustrated (MF, SRLF index > 1) and neutral (N, −1 < SRLF index < 1). From the combinatorial analysis of evolution and frustration, CaM residues are divided in six groups: (MF, C); (HF, C); (HF, NC); (MF, NC); (N, C); and (N, NC) in (B). The secondary structure of CaM is shown below Panel (A) with the sequence in one letter amino-acid code. In the secondary structure of CaM, 8 helices are shown in rectangle from A to H. The 4 Ca2+-binding loops are indicted from I to IV. The CaM residues in the sequence are colored based on the rvET score and SRLF index: red (HF, C), orange (HF, NC), cyan (MF, NC) and green (MF, C) in bold letters. Similarly, the residues that belong to (HF, C), (HF, NC), (MF, NC) and (MF, C) classes are colored accordingly in the three-dimensional structure of CaM (from CaM-CaMKI complex) and represented in spheres. Residue Tyr99 of CaM from (HF, NC) class is indicated by circle.

