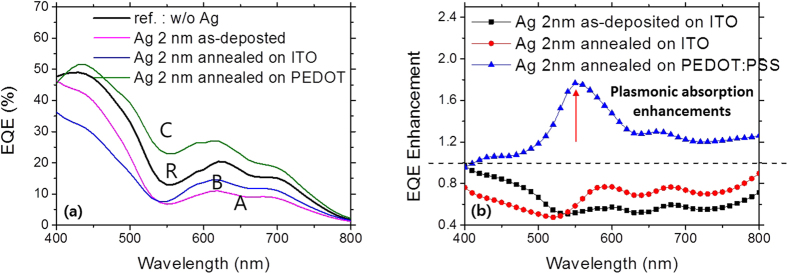
Figure 5.

(a) The EQE spectra of the devices without the Ag nanoparticles and with the annealed Ag nanoparticles on the different substrates. (R) denotes the reference device without the Ag nanoparticle, (A) the device with the as-deposited Ag nanoparticles of 2 nm nominal thickness, (B) the device with the annealed Ag nanoparticles on ITO, and (C) the device with the annealed Ag nanoparticles on PEDOT:PSS. (b) The EQE enhancements of the devices with the as-deposited Ag nanoparticles and with the annealed ones for the different substrates of ITO glass and PEDOT:PSS coated ITO glass. The red arrow denotes a peak EQE enhancement.
