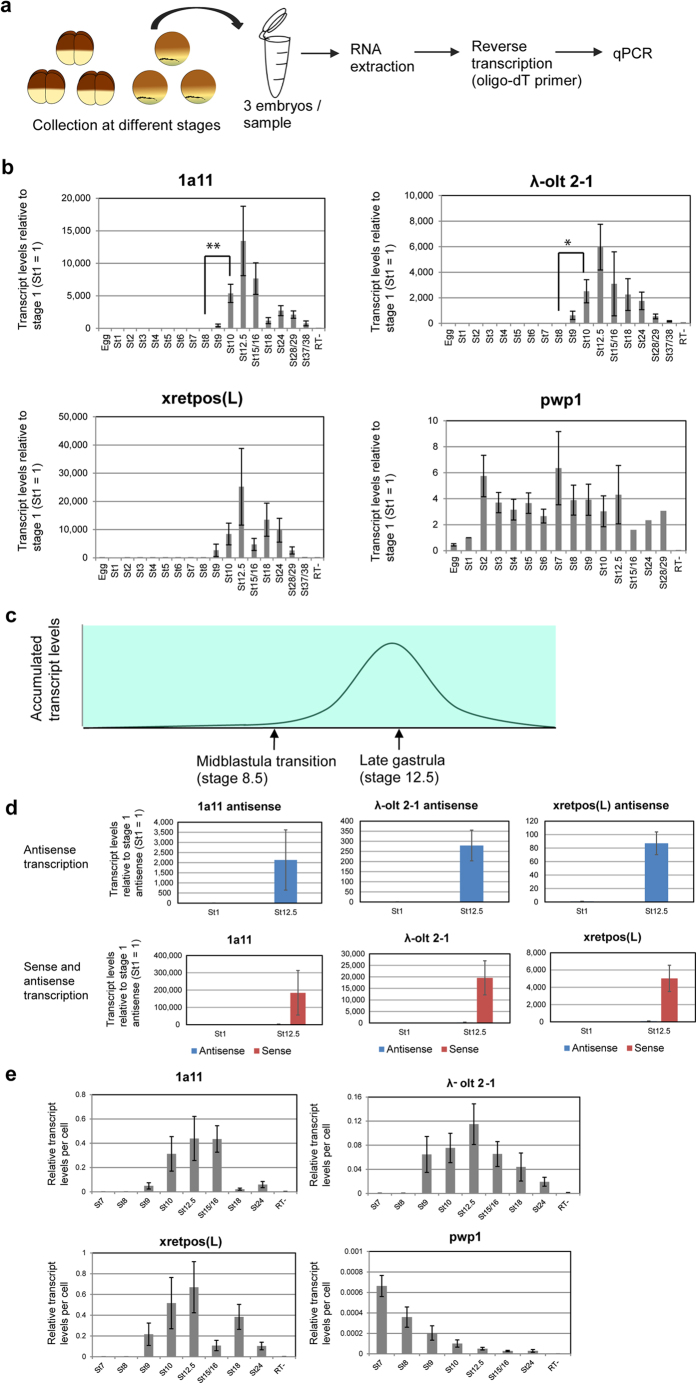
Figure 1. Developmentally regulated expression of retrotransposons 1a11, λ-olt 2-1 and xretpos(L) during Xenopus laevis embryonic development.
(a) Schematic diagram of expression analysis during embryonic development. Embryos were collected at different stages. After RNA extraction and reverse transcription the transcript level was determined by qPCR. The container was drawn by S.H. (b) Relative changes of the transcript levels of 1a11, λ-olt 2-1 and xretpos(L) during embryogenesis in comparison to their transcript levels at the one-cell stage (St1 = 1) (n = 3–14). pwp1 is a constantly expressed gene that was used as control (n = 1–4). All values were normalized to the overall RNA concentration of the respective sample. Sample RT- is a negative control. Error bars represent SEM. **P = 0.005, *P = 0.021. (c) Schematic diagram of the accumulated transcript levels of 1a11, λ-olt 2-1 and xretpos(L) during embryogenesis, explaining that their expression is upregulated after midblastula transition and shows the highest level at the late gastrula stage. (d) 1a11, λ-olt 2-1 and xretpos(L) are mainly detected as sense transcripts although antisense transcription can also be found. Forward primers were used for reverse transcription to analyze the expression of antisense transcripts from retrotransposons (blue bars), while reverse primers were used as a control (red bars). Upper graphs summarize antisense transcription at stages 1 and 12.5. Lower graphs represent the comparison between sense and antisense transcription although antisense transcription is almost invisible due to its much weaker expression than sense transcription. Relative transcript levels were compared to the transcript levels at the one-cell stage (St1 = 1) (n = 4). (e) Normalization by the cell number also indicates the upregulated expression of retrotransposons after midblastula transition and the downregulated expression after the gastrula stage. Relative changes of the transcript levels of 1a11, λ-olt 2-1, xretpos(L) and pwp1 per cell during embryogenesis in comparison to their transcript levels at the one-cell stage (St1 = 1) (n = 3–13). Error bars represent SEM. Only values from stage 7 onwards are shown, since the increase of the cell number is less constant during the first six stages (Supplementary Fig. S3).

