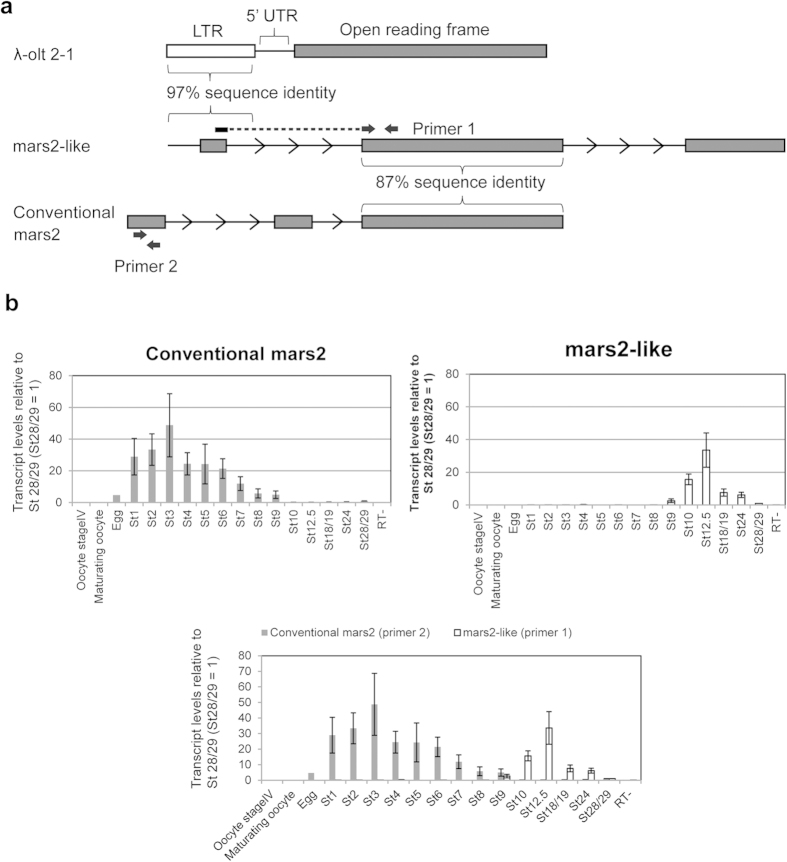
Figure 2. The differential expression pattern between mars2-like and conventional mars2 during embryonic development.
(a) The structure of λ-olt 2-1, mars2-like and conventional mars2. Grey boxes represent exons and the white box represents the LTR of λ-olt 2-1. The first exon of mars2-like and its surrounding region show 97% sequence identity to the LTR of λ-olt 2-1; the second exon shows 87% sequence identity to the third exon of conventional Xenopus mars2; the third exon shows no sequence identity to any reported gene. The full nucleotide sequence of mars2-like is shown in Supplementary Figure S5. Arrows represent binding sites of primer pairs used for qPCR. The forward primer of primer pair 1 binds to the splicing junction between exon 1 and exon 2 of mars2-like. Primer 2 binds to exon1 of conventional mars2. (b) Changes in the transcript levels of mars2-like and conventional mars2 during embryogenesis in comparison to their transcript levels at stage 28/29 (St28/29 = 1). Stage 28/29 was used as a reference here instead of stage 1, since the transcript level of conventional mars2 is already very high at stage 1. The figure at the bottom shows a merge of mars2-like (primer 1) and conventional mars2 (primer 2). All values were normalized to the overall RNA concentration of the respective sample. Sample RT- is a negative control. All error bars represent SEM. n = 3–7.

