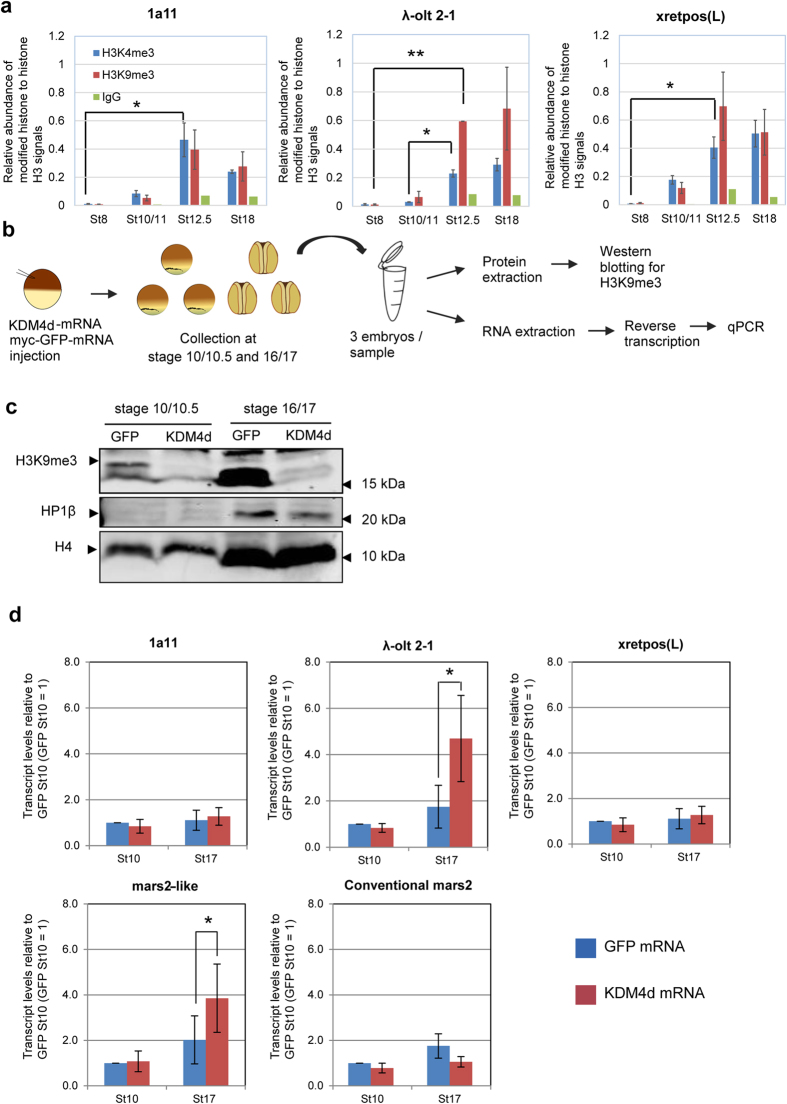
Figure 4. KDM4d overexpression removes H3K9me3 in embryos and upregulates λ-olt 2-1 at the neurula stage.
(a) ChIP analysis indicates enrichment of H3K4me3 and H3K9me3 on LTRs of retrotransposons at different stages of embryogenesis. The precipitated DNA/input DNA of 1a11, λ-olt 2-1 and xretpos(L) was determined by qPCR. (H3K4me3 and H3K9me3: n = 3–4, IgG: n = 2). All values of modified histone and control IgG were normalized to H3 (Supplementary Fig. 6b). All error bars represent SEM. **P = 0.00008, *P < 0.05. Blue = H3K4me3, red = H3K9me3, and green = IgG. (b) KDM4d mRNA was injected into fertilized embryos to remove H3K9me3 during embryogenesis. At the gastrula stage (stage 10) and at the neurula stage (stage 17) embryos were collected and prepared for western blotting or qPCR. Myc-GFP mRNA was used as a control. The container was drawn by S.H. (c) Removal of H3K9me3 by KDM4d mRNA injection was verified by western blot. The same samples were used to detect the expression of HP1β in Xenopus embryos. Histone 4 (H4) was used as a loading control. (d) The effect of KDM4d overexpression on retrotransposons expression and on the expression of mars2-like and conventional mars2 at the gastrula (St10) and the neurula stages (St17). Transcription was measured by RT-qPCR. The relative change of the transcript level in comparison to the transcript level of control myc-GFP mRNA-injected embryos is shown. The transcript level of myc-GFP mRNA-injected embryos at stage 10 was set 1. All values were normalized to the RNA concentration of the sample. All error bars represent SEM. n = 3–5. *P < 0.05. Blue bars represent myc-GFP mRNA-injected embryos while red bars are KDM4d mRNA-injected embryos.

