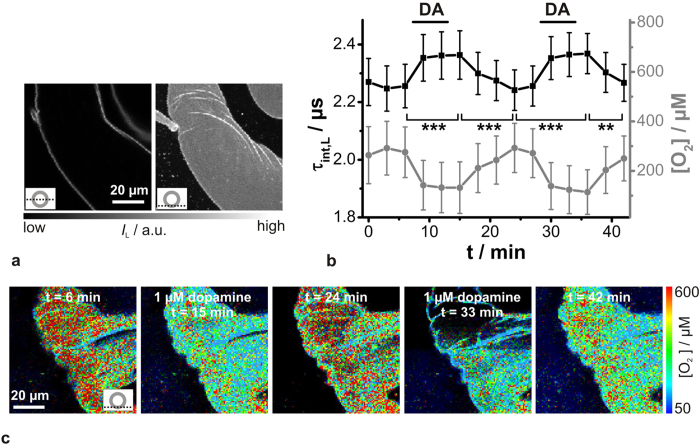
Figure 2. Analysis of dopamine-induced [O2] changes in Kr341-treated salivary duct cells by PLIM recordings.
(a) Luminescence intensity IL images of Kr341-treated salivary duct cells. The optical section plane through the gland duct is indicated (lower left of each image). (b) 1 μM dopamine-induced (DA) changes in Kr341 luminescence decay time τint,L (black data points; means ± SEM, N = 12) and statistical analyses (***P < 0.001, **P < 0.01) and corresponding pericellular [O2] values (grey data points) based on a three-point in situ calibration procedure. (c) Representative PLIM images of the Kr341-treated ducts at distinct time points. Recording parameters: 200 pixel × 200 pixel, 80 μm × 80 μm, pixel dwell time 0.4 ms/pixel, TCSPC time resolution 800 ps, repetition rate 50 kHz. Warmer colours indicate higher pericellular [O2] values and shorter luminescence decay times and cooler colours vice versa. The optical section plane through the gland duct is indicated in the lower right of the first image. The luminescence intensity levels of the PLIM images were adjusted for better visibility.

