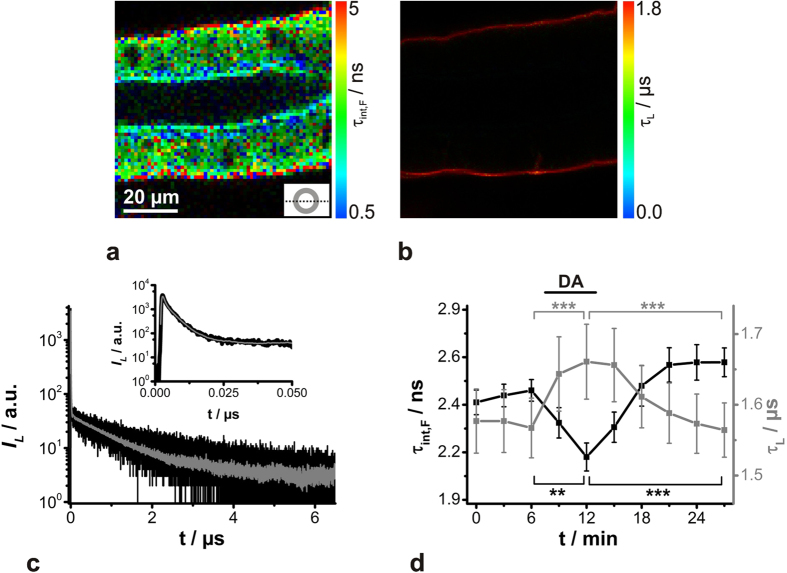
Figure 6. Observation of dopamine-induced (DA) changes of O2 and FAD in cockroach salivary duct cells by simultaneous PLIM/FLIM recordings.
Gland preparations were incubated with the O2-sensitive sensor Kr341 and, subsequently, its luminescence was recorded together with intrinsic autofluorescence by choosing an intermediate TCSPC time resolution. Representative (a) FLIM and (b) corresponding PLIM images of a Kr341-treated salivary duct are shown. Recording parameters: 200 pixel × 200 pixel, 80 μm × 80 μm, pixel dwell time 2.0 ms/pixel, TCSPC time resolution 200 ps, repetition rate 50 kHz. The optical section plane through the gland duct is indicated in the lower right. (c) Luminescence decay curve (black) of simultaneously recorded ns-decaying FAD and μs-decaying O2 sensor Kr341 and the corresponding fits (grey solid line; for details, see Fig S4A,B). The inset depicts an enlargement of the steeply falling fluorescence at the beginning of the decay curve. (d) Simultaneous determination of resting τint,F (black, FAD) and τL (grey, O2) in cockroach salivary duct cells and the effect of dopamine stimulation analysed from PLIM/FLIM images; means ± SEM of N = 10 and statistical analyses (***P < 0.001, **P < 0.01).

