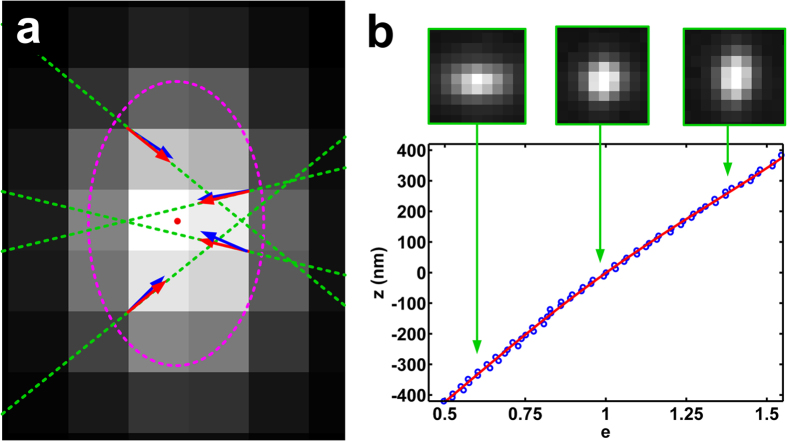
Figure 1. The principle of the gradient fitting based algorithm.
(a) The image of a single fluorescent emitter, where the red dot indicates the exact x–y position of the molecule, the red and blue arrows show the exact gradient directions and the calculated gradient directions of that position, respectively; the green dashed lines indicate the corresponding exact gradient lines, and the magenta dashed ellipse indicates the shape of the PSF. (b) The z–e (ellipticity) calibration curve used to look up the axial position according to the calculated ellipticity. Three representative patterns of a single emitter are shown to indicate the PSFs at the corresponding axial positions. Note that a 4th-order polynomial function is used to fit the z–e calibration curve.

