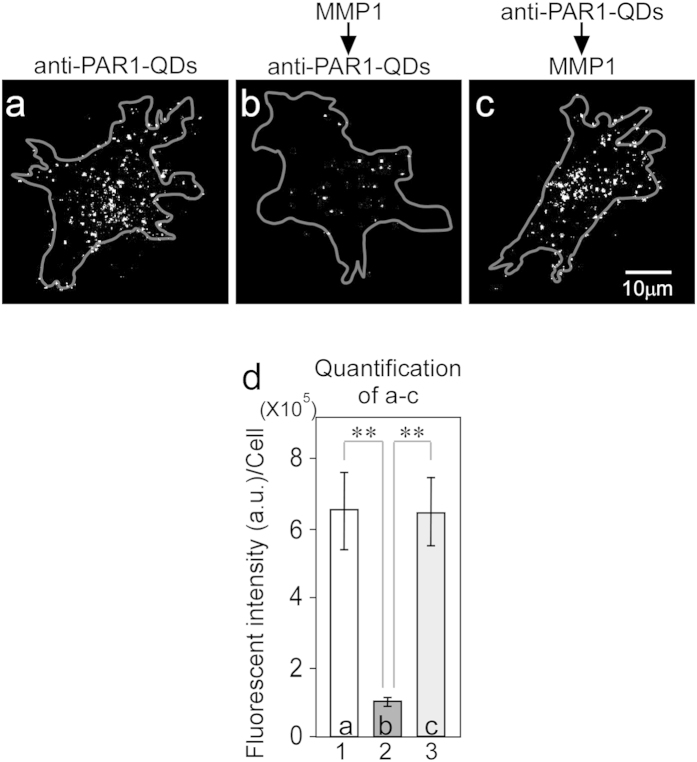
Figure 1. Monoclonal anti-PAR1 antibody abrogates the PAR1-cleaving activity of MMP1.
(a–c) Fluorescence images showing the effect of anti-PAR1 antibody on the PAR1-cleaving activity of MMP1. In all of the cell images, anti-PAR1-QDs on the cell membrane located near the glass surface were visualized. The gray lines show the cellular outline delineated using bright-field images. The bright spots are the QD signals. Excitation wavelength (Ex), 488 nm; emission wavelength (Em), 695–740 nm. (a) PAR1-KPL cell treated with 40 nM anti-PAR1-QDs. (b) PAR1-KPL cell treated with 50 nM MMP1 and then with 40 nM anti-PAR1-QDs. (c) PAR1-KPL cell treated with 40 nM anti-PAR1-QDs and then with 50 nM MMP1. (d) The fluorescence intensities of QDs in a cell were calculated in the above three experiments. In each condition, the QD-fluorescence intensity of 11 cells in a cell were measured and calculated as gray values. Error bars indicate s.e.m. **indicates P < 0.01.

