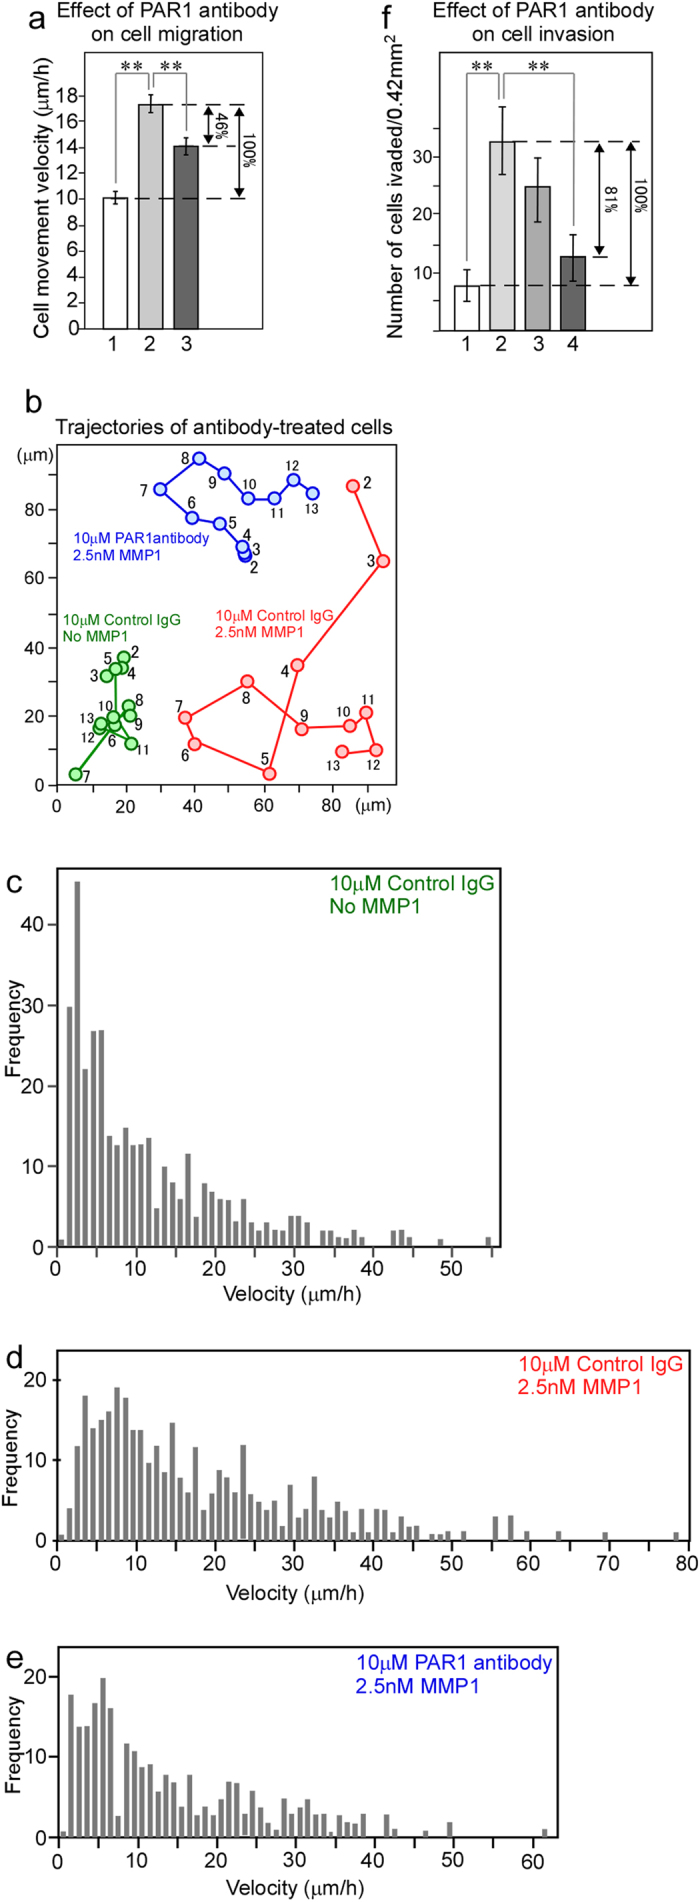
Figure 2. Monoclonal anti-PAR1 antibody inhibits PAR1-KPL cell migration and invasion activated by MMP1.

(a) The effect of anti-PAR1 antibody/inhibitory activity on cell migration. Bar 1, migration velocity of cells treated with 10 μM control mouse IgG. Bar 2, velocity of cells treated with 10 μM control mouse IgG and then 2.5 nM MMP1. Bar 3, velocity of cells treated with 10 μM anti-PAR1 antibody and then 2.5 nM MMP1. In each condition, the nuclear barycentric positions of approximately 30 cells from 2–13-h video data were tracked, and the position of each cell every hour was calculated as the migration velocity (μm/h). (b) Typical patterns of the trajectories of antibody-treated PAR1-KPL cells. The numbers within the trajectories indicate the time (hours) after the start of the time-lapse imaging. (c) Histogram showing the velocity of PAR1-KPL cells treated with 10 μM control mouse IgG. (d) Histogram showing the velocity of PAR1-KPL cells treated with 10 μM control mouse IgG and then 2.5 nM MMP1. (e) Histogram showing the velocity of PAR1-KPL cells treated with 10 μM anti-PAR1 antibody and then 2.5 nM MMP1. The mean of all of the values in (c–e) are shown in bars 1, 2, and 3 in (a), respectively. (f) The effect of anti-PAR1 antibody-inhibitory activity on PAR1-KPL-cell invasion. Bar 1, the number of invading cells in a 0.42-mm2 area treated with 10 μM control mouse IgG. Bar 2, the number of invading cells in a 0.42-mm2 area treated with 10 μM control mouse IgG and then 2.5 nM MMP1. Bar 3, the number of invading cells in a 0.42-mm2 area treated with 3 μM anti-PAR1 antibody and then 2.5 nM MMP1. Bar 4, the number of invading PAR1-KPL cells in a 0.42-mm2 area treated with 10 μM anti-PAR1 antibody and then 2.5 nM MMP1. Error bars indicate s.e.m. **indicates P < 0.01.
