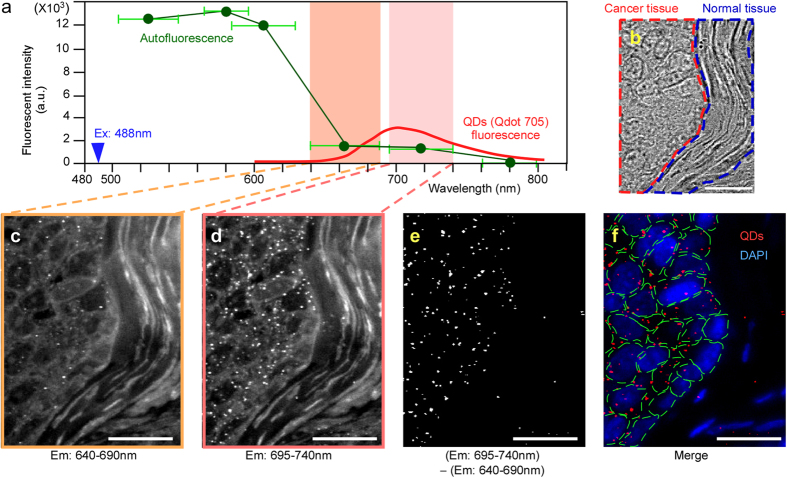
Figure 3. Development of single anti-PAR1-QD particle imaging of human breast cancer tissues.
(a) The fluorescence-intensity curves for autofluorescence (green line) and QDs (red line) in 488-nm laser-excited tissues (blue arrowhead). To measure the autofluorescence pattern, the autofluorescence intensity was examined at various wavelengths in human breast cancer tissues using various bandpass filters (505–545 nm, 565–595 nm, 585–630 nm, 640–690 nm, 695–740 nm, and 760–800 nm). The fluorescence intensity at various wavelengths was divided by the wavelength interval. The averaged fluorescence intensity was plotted as the center value of the individual wavelengths, i.e., the calculated fluorescence intensity filtered with bandpass filters of 505–545 nm, 565–595 nm, 585–630 nm, 640–690 nm, 695–740 nm, and 760–800 nm were plotted at 525, 580, 607.5, 665, 717.5, and 780 nm, respectively. The horizontal green lines show the wavelength interval of each bandpass filter. The change in QD fluorescence was obtained from the Life Technologies website. The value of the QD-fluorescence interval ranging from 695–740 nm became 1.9-fold greater than that of the autofluorescence ranging from 695–740 nm. (b) Bright-field image of a human breast cancer tissue section including cancer (red area) and normal tissues (blue area). (c) The image filtered with the 640–690-nm bandpass filter. This image contains mainly the autofluorescence signal. (d) The image filtered with the 695–740-nm bandpass filter. This image contains the QD and autofluorescence signals. (e) The image after subtracting the 640–690-nm image (c) from the 695–740-nm image (d). Only the QD-fluorescence signals are visualized. (f) The merged image of QD signals (red spots) and nuclei of cancer cells (blue) stained with DAPI. The green lines indicate the cellular outline delineated using a bright-field image. Bar, 20 μm.

