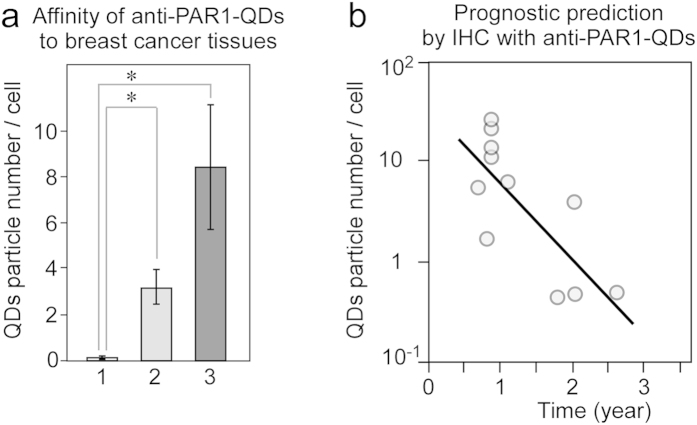
Figure 5. Development of prognostic prediction by IHC with anti-PAR1-QDs in human breast cancer.
(a) A graph showing the affinity of anti-PAR1-QDs for human breast tissue. Bar 1, the number of anti-PAR1-QDs in a normal epithelial cell of the breast (n = 4 tissues). Bar 2, the number of anti-PAR1-QDs in a breast cancer cell representative of cases that remained non-metastatic for more than 5 years after surgery (n = 5 tissues). Bar 3, the number of anti-PAR1-QDs in a breast cancer cell representative of metastatic cases with recurrence within 3 years after surgery (n = 11 tissues). *indicates P < 0.05. The numbers of anti-PAR1-QDs specifically bound to the tissues from each patient are shown in Table 1. (b) A scatterplot diagram showing the number of anti-PAR1-QD particles in a metastatic cancer cell sample (a, bar 3) and relapse-free survival time (year) after surgery. The logarithmic y-axis shows the number of anti-PAR1-QD particles. The x-axis shows the relapse-free survival time (year) after surgery. The line graph shows the inverse correlation between these two factors. The correlation coefficient (R) is 0.75.

