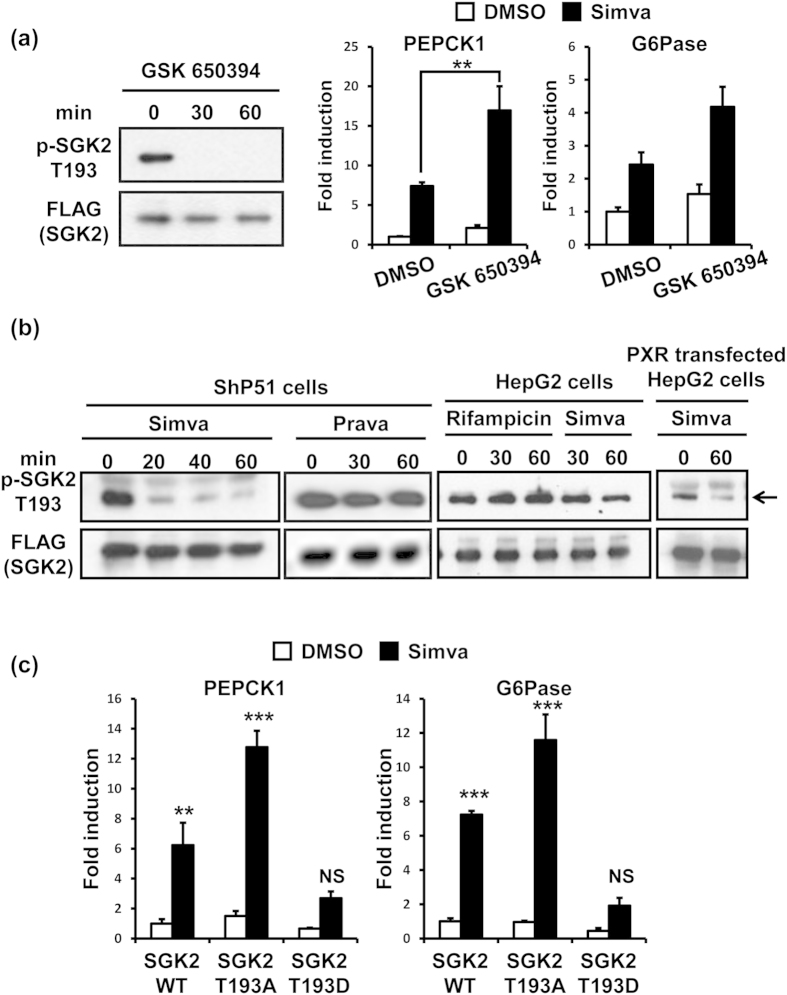
Figure 2. Statin activated PXR-dependent SGK2 dephosphorylation.
(a) Left, Western blot analysis of immunoprecipitated p-SGK2 T193 and FLAG-SGK2 from whole cell lysates in pcDNA/FLAG/SGK2-transfected ShP51 cells treated with GSK650394 (10 μM) for 30 and 60 min. Right, relative expression of PEPCK1 and G6Pase mRNA levels measured by qRT-PCR in ShP51 cells pretreated with GSK650394 (10 μM) for 1 h, followed by co-treatment with simvastatin (Simva, 10 μM) for additional 3 h. Results are shown as fold change relative to DMSO treated cells (n = 3, mean ± s.d). (b) Western blot analysis of immunoprecipitated p-SGK2 T193 and FLAG-SGK2 from whole cell lysates in pcDNA/FLAG/SGK2-transfected ShP51 cells treated with simvastatin (Simva, 10 μM) or pravastatin (Prava, 10 μM) for 20, 30, 40 and 60 min (Left), in pcDNA/FLAG/SGK2-transfected HepG2 cells treated with rifampicin (100 μM) or simvastatin (Simva, 10 μM) for 30 and 60 min (middle), and in pcDNA/FLAG/SGK2 and pCR3/PXR-transfected HepG2 cells treated with simvastatin (Simva, 10 μM) for 60 min (right). Data shown were generated from , at least, three indsepedent experiments. (c) Relative expression of PEPCK1 and G6Pase mRNA levels measured by qRT-PCR in ShP51 cells which were transfected with pcDNA/SGK2 wild type (WT), pcDNA/SGK2 T193A or pcDNA/SGK2 T193D after endogenous SGK2 was knocked down by siRNA, followed by treatment with simvastatin (Simva, 10 μM) for 3 h. Results are shown as fold change relative to DMSO treated SGK2 WT-transfected cells (n = 3, mean ± s.d) *P < 0.05, **P < 0.01, ***P < 0.001. NS, not significant by One-way ANOVA analysis.

