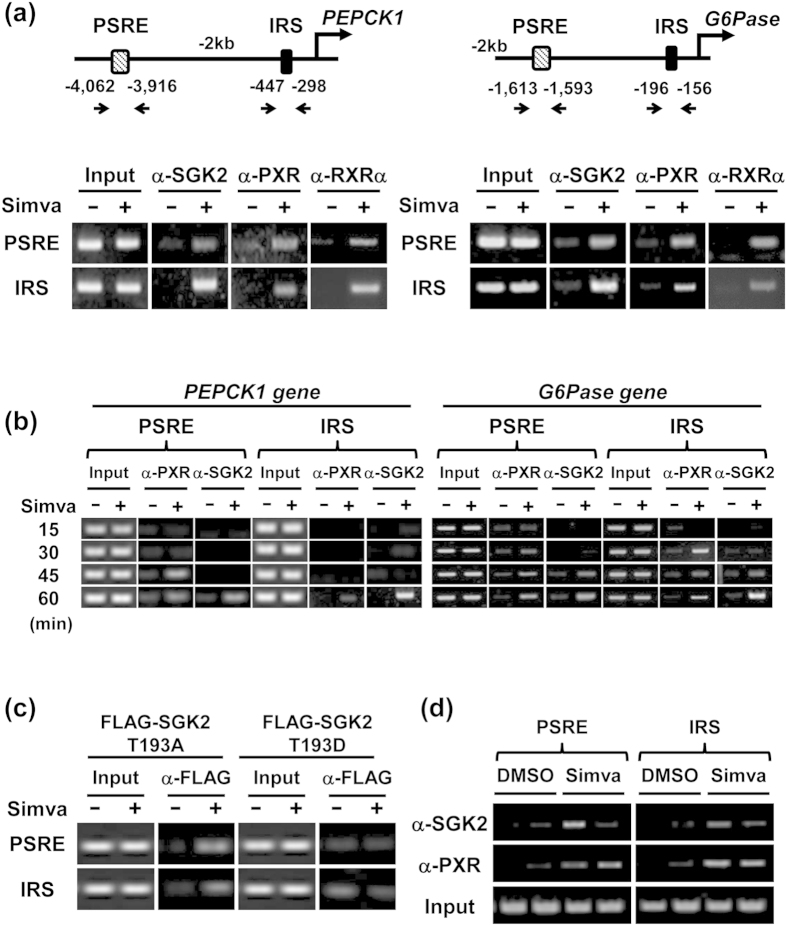
Figure 4. PXR-SGK2 responsiveness of the PEPCK1 and G6Pase promoters.
(a) Top, schematic representation of upstream region of the PEPCK1 (left) and G6Pase (right) genes. Bottom, ChIP assays of SGK2, PXR and RXRα levels at PSRE (PEPCK1: −4,062/−3,916, G6Pase: −1,613/−1,593) and IRS (PEPCK1: −447/−298, G6Pase: −196/−156) regions in ShP51 cells treated with simvastatin (Simva, 10 μM) for 60 min (b) Time course ChIP assays of SGK2 and PXR levels at PSRE and IRS regions in ShP51 cells treated with simvastatin (Simva, 10 μM) for 15, 30, 45 and 60 min. (c) ChIP assays of SGK2 T193A and SGK2 T193Dlevels at PSRE and IRS regions in pcDNA/FLAG-SGK2 T193A or pcDNA/FLAG-SGK2T193D-transfected ShP51 cells treated with simvastatin (Simva, 10 μM) for 1 h. (d) ChIP assays of SGK2 and PXR levels at PSRE and IRS regions in human primary hepatocytes treated with simvastatin (Simva, 10 μM) for 3 h. Data shown were generated from three independent experiments.

