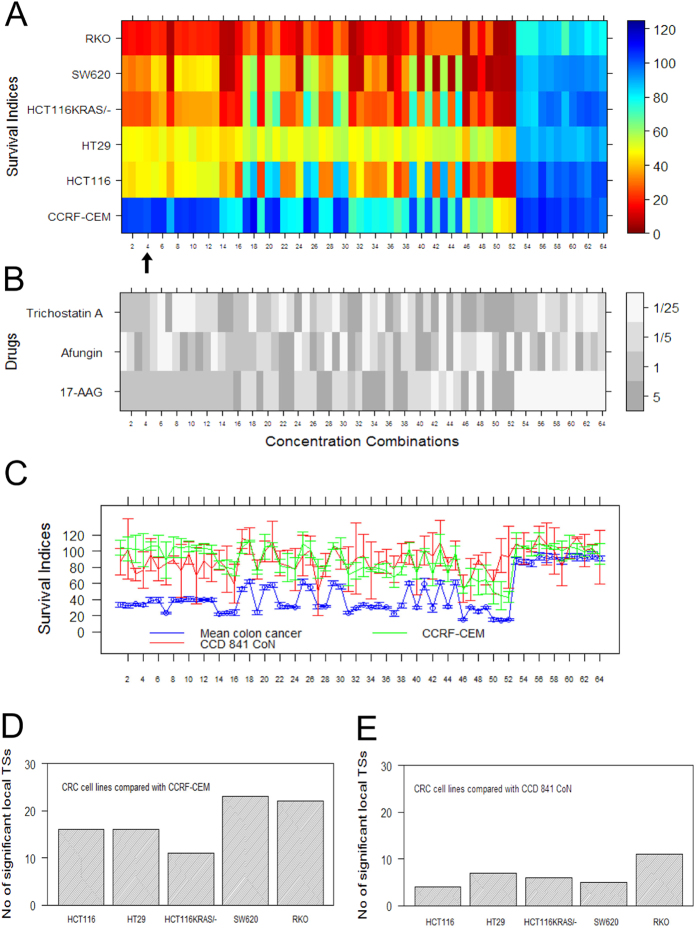
Figure 2. Factorial concentration-response study of combination (17-AAG, Afungin, Trichostatin A) and TS (therapeutic synergy).
Each of 64 different concentration combinations was tested across five CRC cell line models and two normal/reference/toxicity cell line models. The concentrations are color coded in panel B and were selected to be 1/25, 1/5, 1 and 5 times the IC20 concentration used in the combination search. (A) Heatmap of SI values (%) for tested CRC cell lines, and the reference/toxicity model CCRF-CEM used in the iterative search, at the concentrations color coded in panel B. The arrow indicates location of the set of concentrations (1, 1, 1, 1) used in the search procedure using the TACS algorithm. (B) Heatmap of the 64 different concentrations tested, sorted by the fitness criterion in Eq (1) used by TACS. (C) Graph of average SI values (concentrations are shown in B) across the five cancer cell lines as well as SI values for the a normal (non-cancerous) colon cell line CCD 841 CoN and normal/reference/toxicity cell line model CCRF-CEM. Error bars indicate 95% confidence intervals. (D) Bar graph showing the number of significant local TSs detected when each CRC cell line is compared with CCRF-CEM. The largest possible number is 48 which would mean that there is a local TS for every concentration combination used. (E) Same kind of results as presented in Panel D but this time with the five CRC cell lines compared with normal (non-cancerous) colon cell line CCD 841 CoN.

