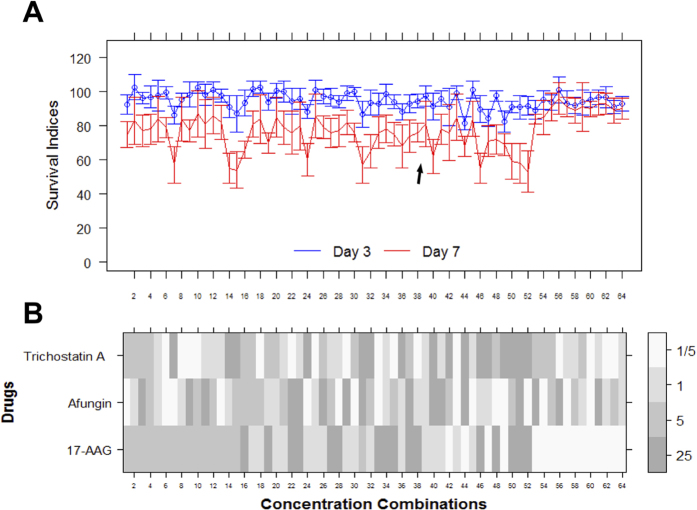
Figure 4. Factorial concentration-response study of combination (17-AAG, Afungin, Trichostatin A) in a HCT116 spheroidal model.
(A) Profiles of SI values (%) for the spheroid model at multiple time points. The SI values are sorted in the same order as in Fig. 2 (although all concentrations here are 5 times higher). The black arrow indicates the concentration combination discovered during the original iterative search. (B) Concentrations corresponding to A expressed as fractions of the concentrations used in the iterative search.

