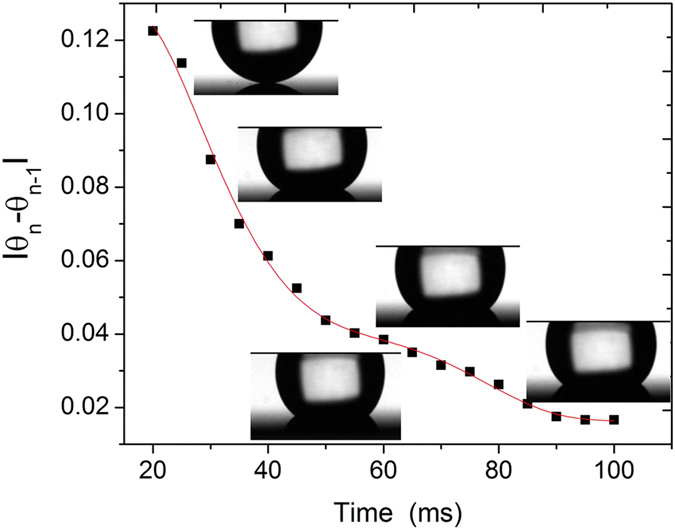
Figure 6. An example of the converged time iteration curve from our model used for estimating the value of the apparent contact angle, θ(t).

The difference  was plotted vs time t and the value of θ(t) was obtained after the solution converged. A large difference in the value of θ(t) indicates non-equilibrium state. The water droplet images shown in the inset demonstrate the droplet shape at different time instances and complements our approach.
