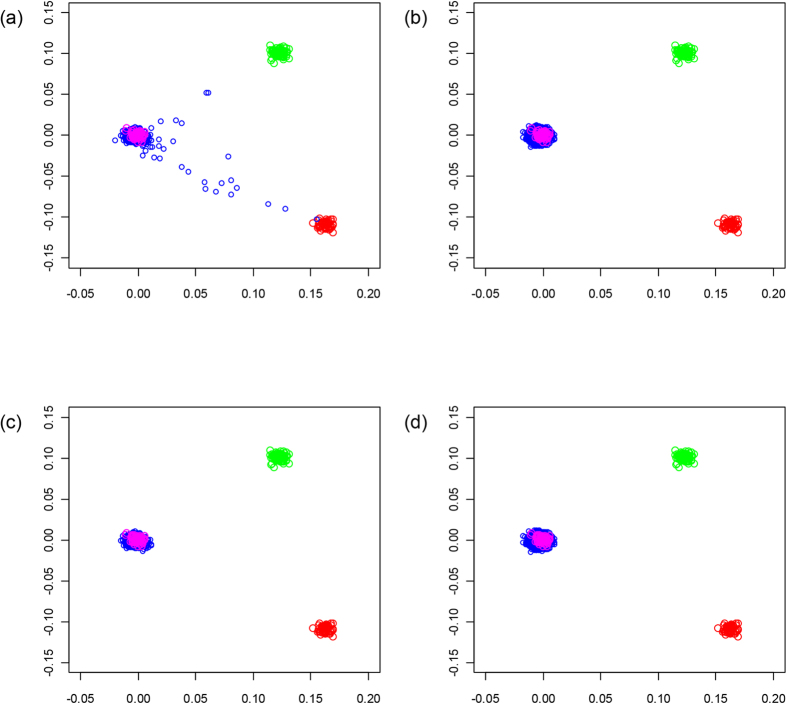
Figure 1. Identification of individuals in the GWAS of non-European ancestry.
The first two principal components of the analysis were plotted. HapMap CEU individuals are plotted in blue; CHB + JPT individuals are plotted in green; YRI individuals are plotted in red; GWAS cases are plotted in pink before (a) and after (c) removal, GWAS controls are plotted pink before (b) and after (d) removal.

