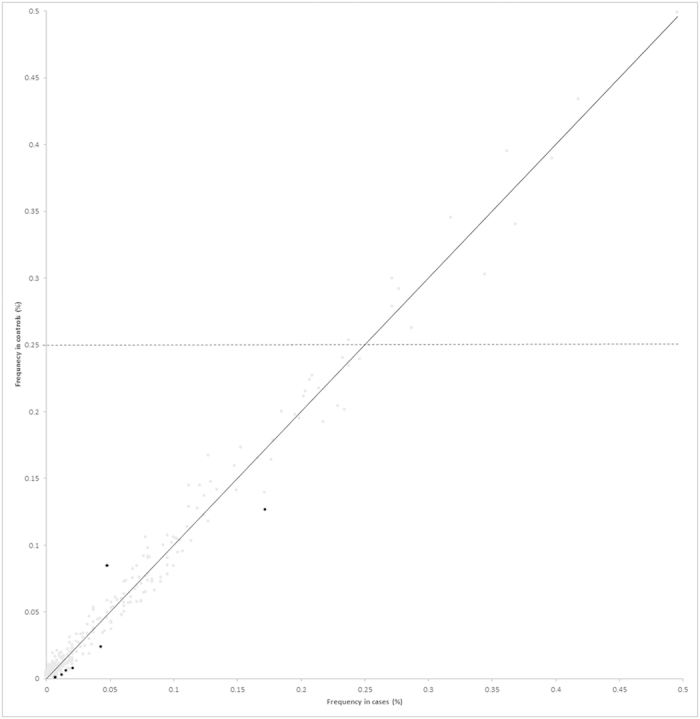
Figure 2. Comparison between the frequencies of the 398 ROH identified, in HL cases and the controls.

The seven ROH coloured black are those that are significantly associated with HL risk (P < 0.01) and the horizontal line shows ROH with frequency >25% in controls.
