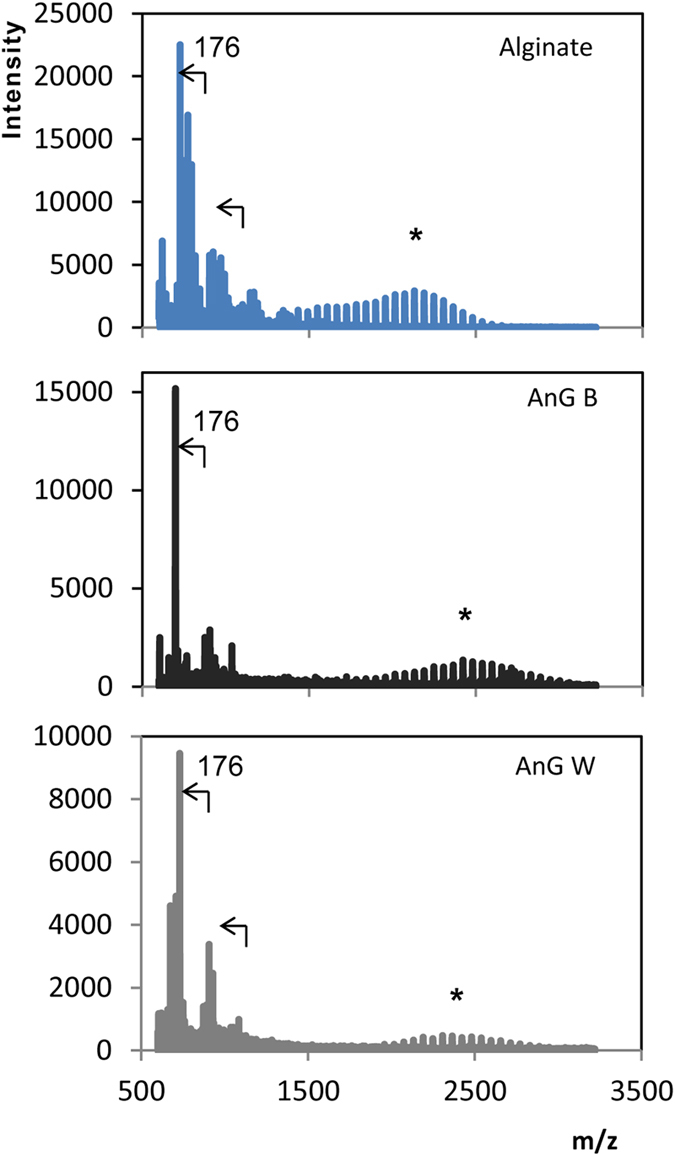
Figure 5. MALDI-TOF MS spectra of alginate and of exopolysaccharides from anaerobic granules AnG B and AnG W exhibiting alginate-like signals.

Arrows indicate m/z differences of 176. The asterisks indicate the bell-shaped zone of the spectra shown in detailed in Fig. 3.
