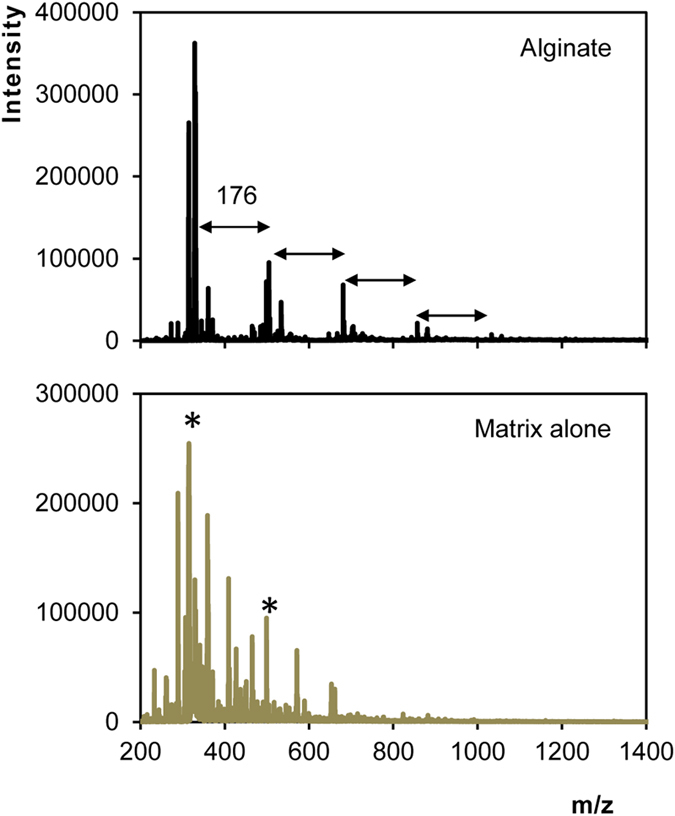
Figure 6. Negative mode of the MALDI-TOF MS spectrum of reference alginate and of the DHB matrix alone.

The spectrum of the matrix alone shows peaks, indicated by the asterisk, which matched those of the alginate spectra.

The spectrum of the matrix alone shows peaks, indicated by the asterisk, which matched those of the alginate spectra.