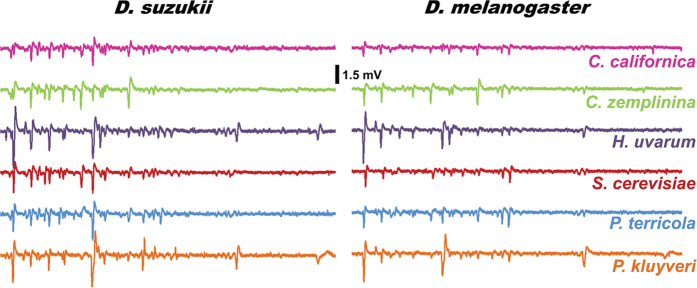
Figure 3. Olfactory responses to yeast derived volatiles are qualitatively and quantitatively different across yeast and fly species as measured by antennal sensitivity.

Representative antennal response profiles were generated by gas chromatography linked electro-antennographic detection (GC-EAD) method which measures response to odor constituents as they elute from the GC column. Refer to Supplementary Figure S3 for the accompanying GC-FID traces; and Supplementary Figure S4 represents comparative responses.
