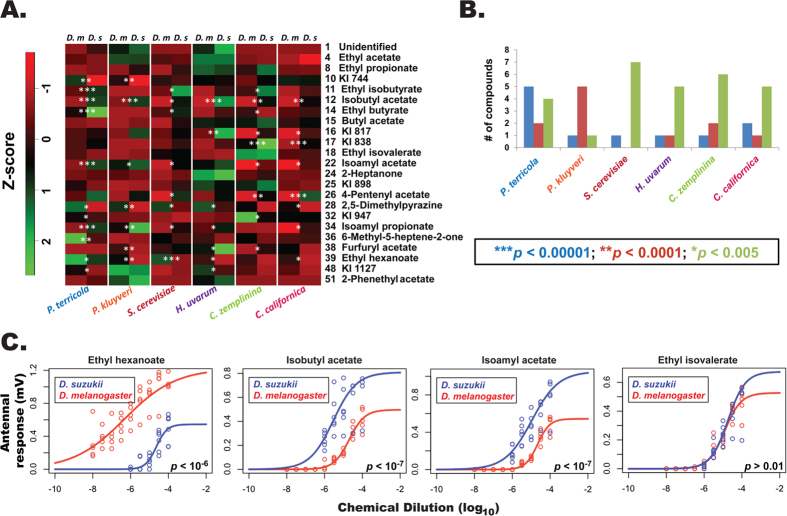
Figure 5. D. suzukii and D. melanogaster respond to the most effective yeast constituents with differential sensitivity and selectivity.
(A) Heat map indicates the varying intensity of responses to an identified odor constituent (rows) in two fly species (individual columns) for a given yeast (grouped column). Antennal responses were mean averaged across a row and set to zero (Z-score; dark represents 0); higher responses (above the average) are indicated in green, whereas red indicates lower responses. White asterisks denote statistical significance between fly species across yeasts. Kovat’s Indices (KI) are used to denote compounds that could not be positively identified. (B) Distribution histogram representing the number of compounds eliciting significant responses between two fly species from a given yeast. (C) Dose-dependent electrophysiological responses measured from fly antennae upon stimulation with increasing doses of biologically active constituents identified from yeast odors that elicited significantly different responses between D. melanogaster and D. suzukii from at least five of the six yeast odor profiles. Ethyl isovalerate served as control.

