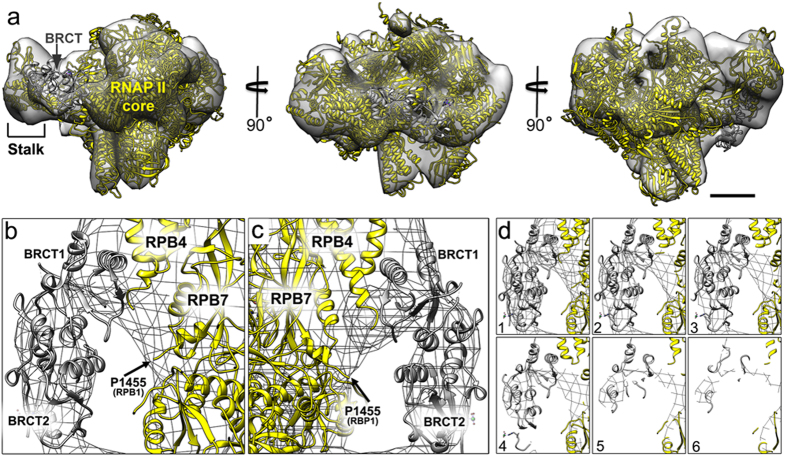
Figure 3. The composite EM reconstruction with the BRCT domain positioned in the density map.
(a) The EM density map is shown in different orientations with the RNAP II core (yellow; pdbcode, 4A933) and BRCT domain (gray; pdbcode, 1JNX6) positioned in the map. The RNAP II stalk domain that consists of subunits RBP4 and RPB7 is also shown within the density map. Scale bar is ~10 nm. (b) A close-up view of the BRCT domain (gray; pdbcode, 1JNX6) composed of BRCT1 and BRCT2 motifs displayed in two opposing views (b,c) with respect to the RNAP II subunits (yellow; pdbcode, 4A933) that define the stalk domain (RPB4/RPB7). The RNAP II large subunit (RPB1) and its terminal residue defined in the crystal structure (P1455; black arrows) are also indicated. (d) Sections (1–6) through the BRCT domain positioned within the EM density map. Please also see Supplementary Movie 1.

