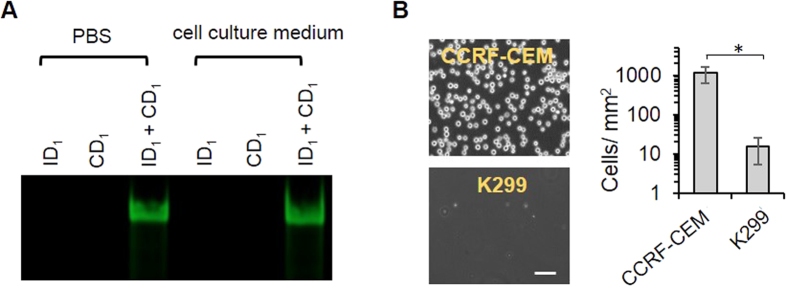
Figure 3. Examination of specific cell catch.

(A) Gel image showing ID1-CD1 hybridization in two different solutions. (B) Imaging and quantitative analysis of cell catch on the hydrogels. The CCRF-CEM (target) cells and K299 (control) cells were incubated on the hydrogel surface for 1 h. Quantitative analysis was performed by the examination of three areas randomly chosen from each image. Cell numbers were analyzed by ImageJ. Scale bar: 50 μm. *P < 0.05; n = 3.
