
Figure 5. Survival rates of mice from the five groups.
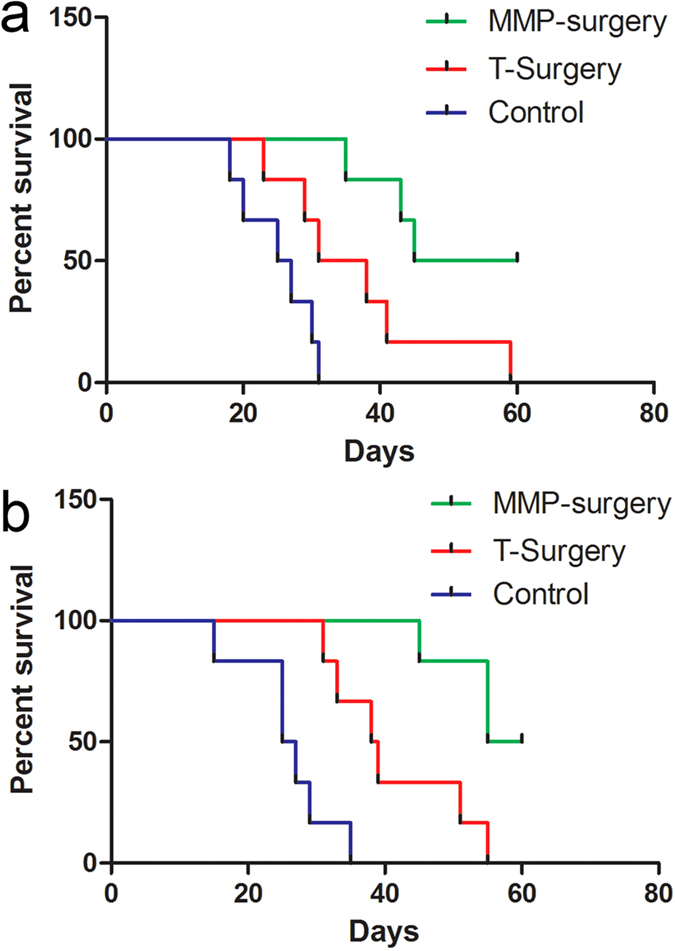
(a) Survival rates in the orthotopic model. For mice undergoing surgery following MMP-750 injection versus mice undergoing traditional surgery, Wilcoxon test, P = 0.03. For the MMP-750 probe versus control method, Wilcoxon test, P = 0.0013. (b) Survival rates in the metastatic model. For mice injected with the MMP-750 probe versus mice undergoing traditional surgery, Wilcoxon test, P = 0.0109. For mice injected with the MMP-750 probe versus the control group, Wilcoxon test, P = 0.0013.