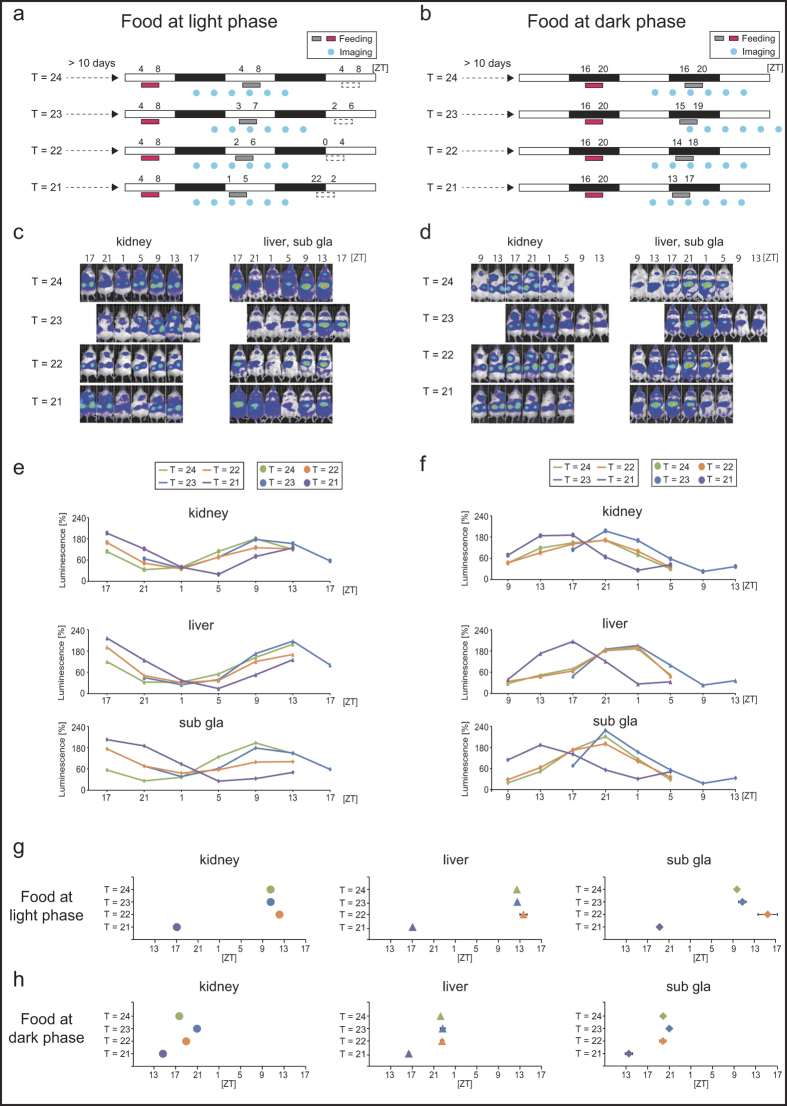
Figure 2. Peripheral PER2::LUCIFERASE (PER2::LUC) bioluminescence under Tau (T) = 21–24-h conditions (Experiment 1).
(a,b) Summary of experiment 1 schedules (as in Fig. 1). Each T-cycle of scheduled feeding (4 h of feeding time, at an interval of 21–24 h) was maintained for at least 10 days, and the PER2::LUC bioluminescence rhythm (the six measurement time points per day are indicated by blue circles) was monitored after food intake (indicated as red boxes) at zeitgeber time (ZT; ZT0 is defined as the time when the light was switched on) 4–8 (light phase, a,c,e,g) or ZT16–20 (dark phase, b,d,f,h). Horizontal open and closed bars indicate light and dark periods, respectively. (c,d) Representative images of the PER2::LUC rhythm in the kidneys, liver, and submandibular gland (Sub gla) under each T-cycle. In the T = 23-h group, the recording time schedule was different from that of the other groups because of some issues with the recording apparatus. (e,f) Average waveforms of the PER2::LUC rhythm. (g,h) Calculated peak phases of the PER2::LUC rhythm. Data are presented as mean ± s.e.m. The number of mice used in this study is listed in Table S1.

