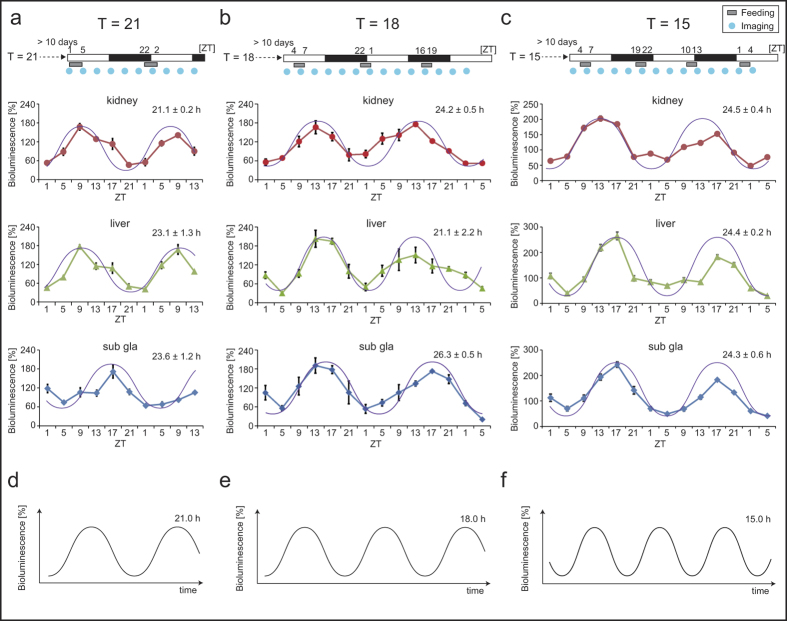
Figure 3. Peripheral PER2::LUCIFERASE (PER2::LUC) bioluminescence under Tau (T) = 15–21-h conditions (Experiment 2).
Experimental schedules (upper). After adaptation to a T = 24-h cycle of food intake at zeitgeber time (ZT; ZT0 is defined as the time when the light was switched on) 4–8 for a minimum of 10 days, each T-cycle of scheduled feeding (3 h of feeding time for T = 15 and 18 h; 4 h of feeding time for T = 21 h) was maintained for a minimum of 10 days, and the PER2::LUC bioluminescence rhythm was monitored at the indicated time points (blue circles). Bioluminescence imaging was performed at 10 time points during 40 h for T = 21 h, or 14 time points during 56 h for T = 18 and 15 h. The averaged waveform of PER2::LUC bioluminescence under T = 21 (a, n = 4), 18 (b, n = 3), and 15 h (c, n = 8) of T-cycle of scheduled feeding (lower). Data are presented as mean ± s.e.m. Fitting analysis to the cosine curve was performed, and the results for the fitting period are presented in each panel. The purple line indicates the cosine curve, with each calculated period fitted to bioluminescence data. (d–f) Ideal examples of the cosine curve for every period of each feeding cycle (T = 21, 18, and 15 h). The time scale presented in the x-axis (d–f) is the same as that shown for each T-cycle data set (a–c).

