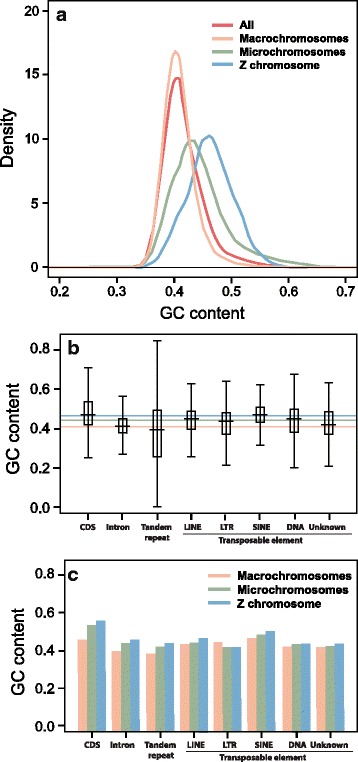
Fig. 4.

Analysis of GC content in Pogona vitticeps. a, Distribution of GC content in all chromosomes, macrochromosomes, microchromosomes and the Z chromosome, calculated with a non-overlap 5-kb sliding windows ; b, GC content of various components of the genome, in comparison with the average GC content for macrochromosomes (red line), microchromosomes (green line) and the Z chromosome (blue line) ; c, GC content of the macrochromosomes, microchromosomes and Z chromosomes broken down for various components of the genome
