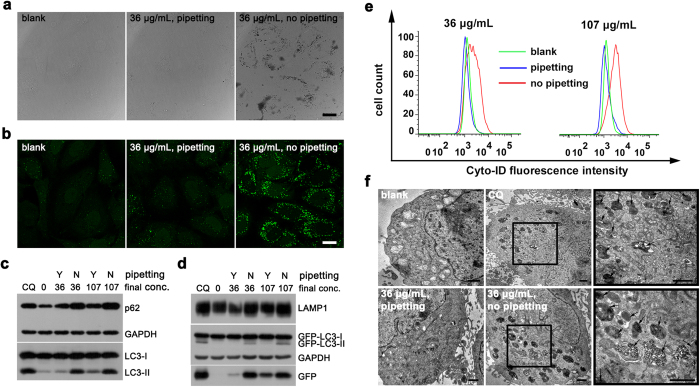
Figure 1. IO@citrate nanoparticles aggregations induce accumulation of autophagic vacuoles.
(a) Confocal bright field images and (b) Fluorescence images of HeLa-GFP-LC3 cells after treatment for 24 h. (c,d) Western blot analysis of autophagy-related proteins after treatment. Cells treated with 10 μM chloroquine (CQ) as a positive control, and cells without any treatment as a negative control. (e) Flow cytometry quantification of autophagic vacuoles. (f) TEM images of HeLa-GFP-LC3 cells before and after treatments. The right views were the magnification of the region with a black box in the middle views. The black arrows in the right views pointed to autophagic vacuoles. Scale bars were 20 μm (a,b) and 1 μm (f) respectively.

