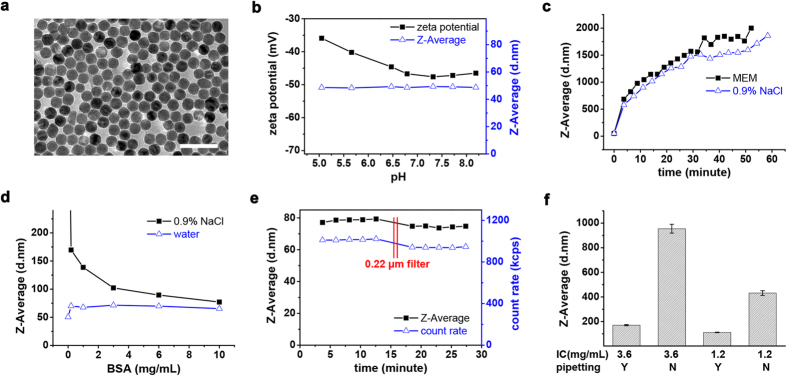
Figure 2. Protein adsorption reduces aggregation of nanoparticles in saline.

(a) TEM image of IO@citrate nanoparticles dispersed in water. Scale bar was 100 nm. (b) Hydrodynamic diameter and zeta potential of IO nanoparticles over pH range. (c–f) Hydrodynamic diameter of IO nanoparticles dispersed in various media. (c) MEM or 0.9% NaCl. (d) BSA aqueous or saline solution. (e) 10 mg/mL BSA saline solution. Solution was filtered by 0.22 μm filter at 16 minutes time point. (f) Complete medium. IO nanoparticles with various initial concentrations (IC) were mixed with complete medium by pipetting or not. The final concentration of Fe was 36 μg/mL (n = 4. Data represent mean ± s.d.).
