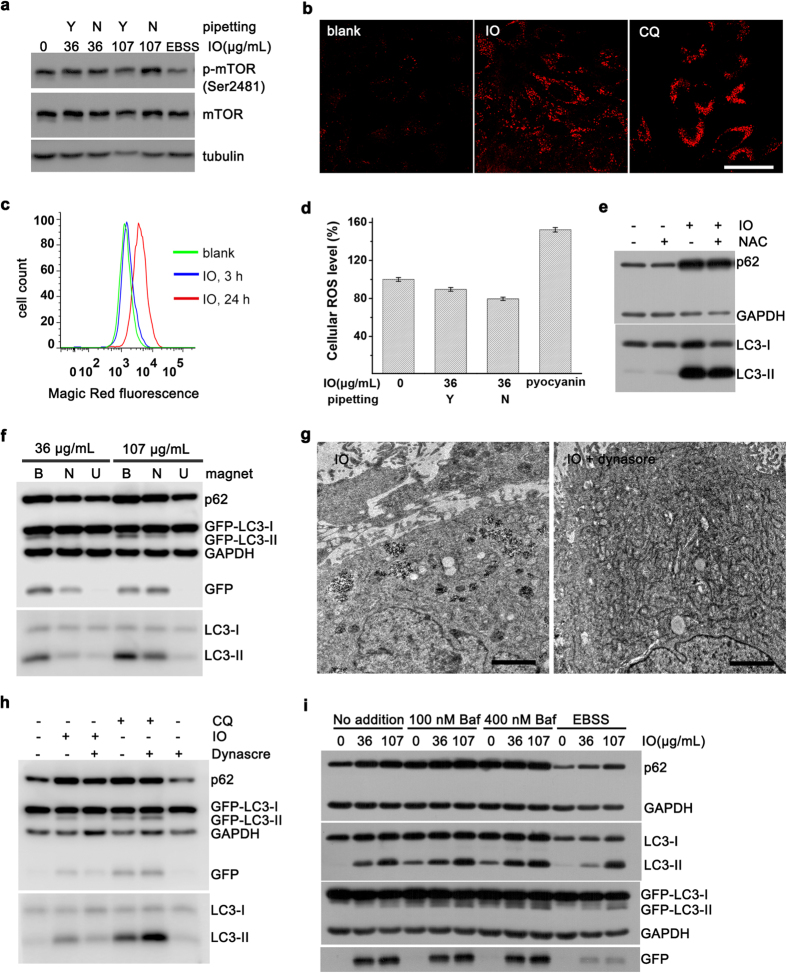
Figure 5. Concurrent cellular responses and autophagic flux assay.
(a) Detection of phosphorylated mTOR. EBSS: When treated with EBSS only for 4 h, cells were starved so that mTOR was dephosphorylated and activated. (b) Immunofluorescence staining of LAMP1. Cells were treated with aggregated nanoparticles or CQ. Scale bar was 50 μm. (c) Enzyme activity of cathepsin B detected by Magic Red staining. (d) Cellular ROS analysis (n = 5. Data represent mean ± s.d.). Pyocyanin is an inducer of ROS. (e) Cells were treated with aggregated nanoparticles alone, or together with NAC. (f) Magnetic fields altered autophagy effect. B: below cells; N: no magnet; U: up cells. (g) TEM images, and (h) Western blot analysis of cells treated with aggregated nanoparticles alone, or together with dynasore for 12 h. Scale bar was 2 μm. (i) Cells were treated with aggregated nanoparticles alone or together with Bafilomycin A1 (Baf) or EBSS at final 5 h. Cells were treated for 24 h unless noted otherwise.

