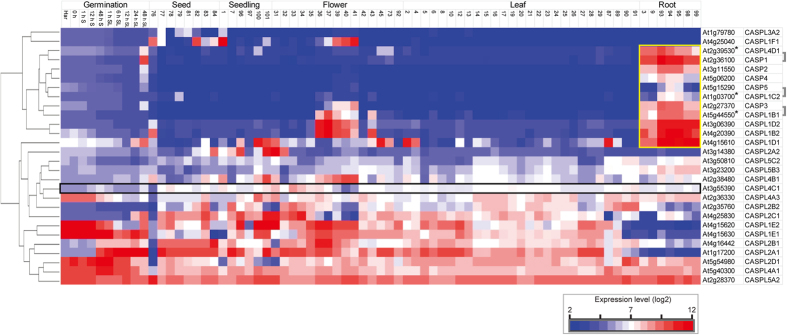
Figure 3. Transcript abundance profiles of 28 genes from the CASP protein family (UPF0497) that are represented on Affymetrix microarray chips.

Transcript abundance is shown over germination and development. Expression levels (log2) are shown for the 28 genes (represented on microarrays) that encoding CASP or CASP-like genes. Hierarchical clustering shows strong co-expression of specific CASP like genes with known CASP genes (strongly co-expressed genes indicated by an asterisk*). The transcript abundance for At3g55390 is shown in a black box, and genes that display a root enriched expression profile are shown in a yellow box. White boxes indicate no expression was detected.
