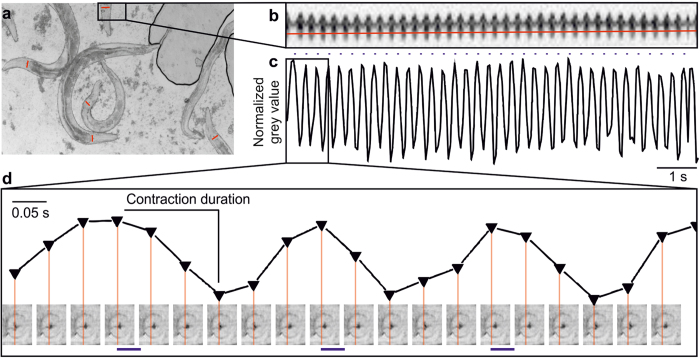
Figure 6. Optical recording of pharynx pumping enabled by kymographic analysis in many animals in parallel.
(a) Micrograph showing several intact animals, immobilized on polystyrene beads. Red lines drawn across the pharynx terminal bulb indicate lines for which kymographic analysis is performed (grey values along the line obtained from each video frame). (b) Kymograph showing grey values of the line depicted in a (a still image of the respective video), upon optogenetic stimulation at 3.7 Hz frequency (35 ms, 470 nm light), for about 30 s. A line scan (red line) across the kymograph is used for detection of pump events, in a plot of grey values as shown in (c,d) Pump parameters are analyzed with a custom written KNIME script, using maximum and minimum grey values as an indication of axial movement of the pharynx grinder, during a pump cycle. Correlation of grey values with the actual images from the corresponding video frames is shown in the lower half. Red lines represent the line for detection of grinder movement (x-axis—time, y-axis—normalized grey value).

