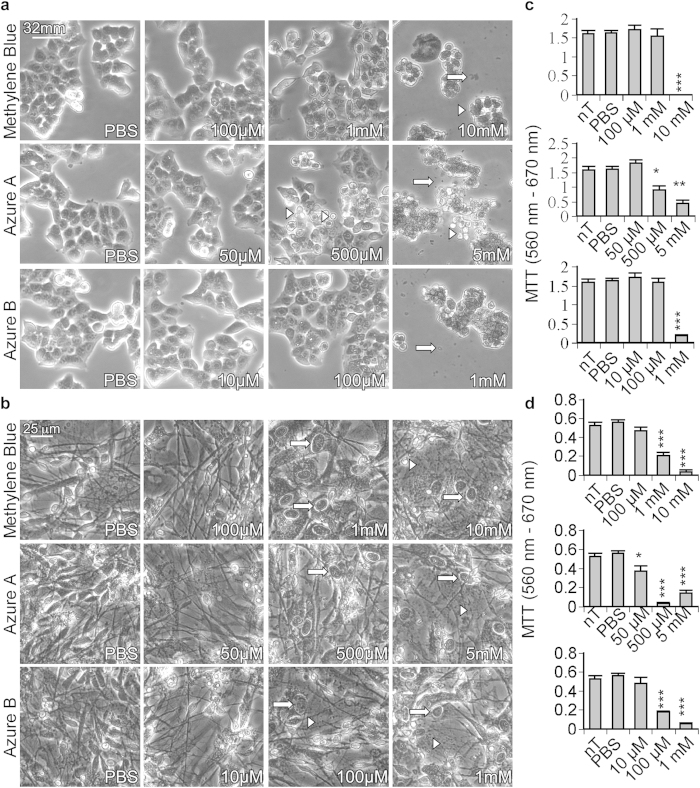
Figure 3. Toxicity of methylene blue, azure A, and azure B in HCT116 cells and human primary neurons.
(a) Phase contrast images of (a) HCT116 cells and (b) human primary CNS neurons treated with an increasing concentration of methylene blue, azure A, or azure B for 2 hours. Round cells (white arrowheads) and cellular debris (white arrows) are indicated in (a), while fragmented axons (white arrowheads) and swollen cell bodies (white arrows) are shown for (b). The mitochondrial reductive potential of HCT116 cells and human primary neurons was measured by MTT assay in the presence or absence of methylene blue, azure A or azure B. HCT116 cells (c) or human primary neurons (d) were either non-treated (nT), treated with PBS, treated with 100 μM to 10 mM methylene blue, 50 μM to 50 mM azure A, or 10 μM to 1 mM azure B for 2 hours. Data represent the mean and SEM of 3 (c) or 4 (d) independent experiments. Statistical difference between phenothiazine treated samples and the PBS control was measured with a one-way ANOVA (p < 0.0001) and post hoc Dunnett’s analysis compared to PBS: *p < 0.05, **p < 0.01, ***p < 0.001.

