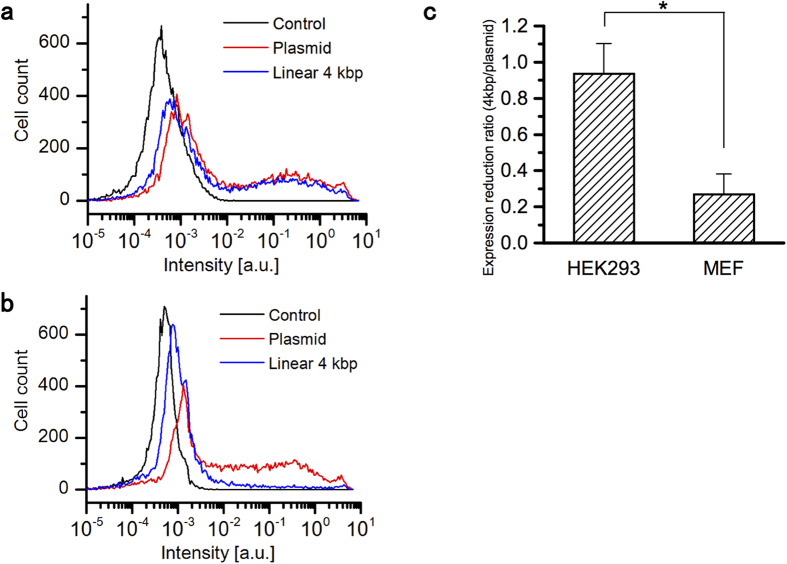
Figure 1. EGFP expression analysis by flow cytometer.
Histograms of EGFP expression rate in (a) HEK293 and (b) MEF cells transfected with the pEGFP-C1 plasmid or linear 4-kbp DNA. Cells without transfection were tested as a background fluorescence intensity control. (c) Expression reduction ratio in the case of plasmid and linear 4-kbp DNA transfection. (P = 0.0068, Student’s t-test).

