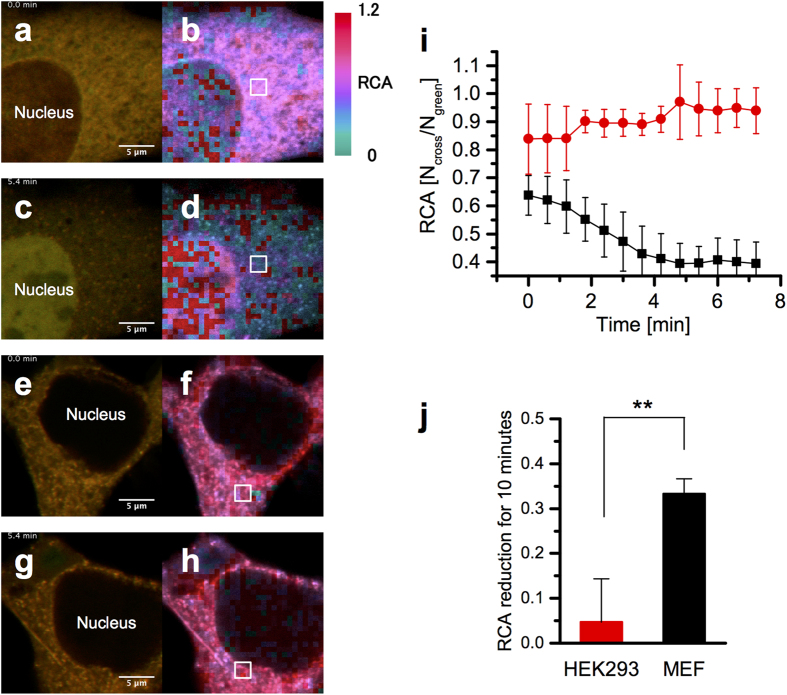
Figure 5. Spatiotemporal ccRICS analysis of DNA degradation in living cells.
(a) LSM image of an MEF cell immediately right after DNA injection and (b) RCA degradation map of ccRICS analysis. (c) LSM image and (d) degradation map of the MEF cell 5.4 min after injection. (e) LSM image of a HEK293 cell immediately after DNA injection and (f) RCA degradation map. (g) LSM image and (h) degradation map of the HEK293 cell 5.4 min after injection. (i) Time dependent RCA changes in MEF (black) and in HEK293 (red) cells at the region indicated by a white square in b, d, f, and h images. Error bar shows standard deviation of nine different regions in a white square. (j) RCA reduction in HEK293 and MEF cells for initial 10 mins after DNA injection (P = 0.0016, Student’s t-test).

